Correlation Covariance Heatmap
Usage
covcor_heat(
  matrix,
  corr = TRUE,
  size = 4,
  digits = 3,
  legend = c(0.6, 0.7),
  upper_tri = FALSE,
  reorder = FALSE
)
Arguments
- matrix
A numeric matrix.
- corr
A logical value indicating if the matrix is in a scaled form (
TRUEby default, correlation matrix)- size
A numeric value to define the letter size.
- digits
A numeric integer to define the number of digits to plot.
- legend
the position of legends ("none", "left", "right", "bottom", "top", or two-element numeric vector)
- upper_tri
A logical value to plot the Lower or Upper Triangular Part of the matrix. FALSE by default.
- reorder
A logical value to reorder by a Hierarchical Clustering. FALSE by default.
Examples
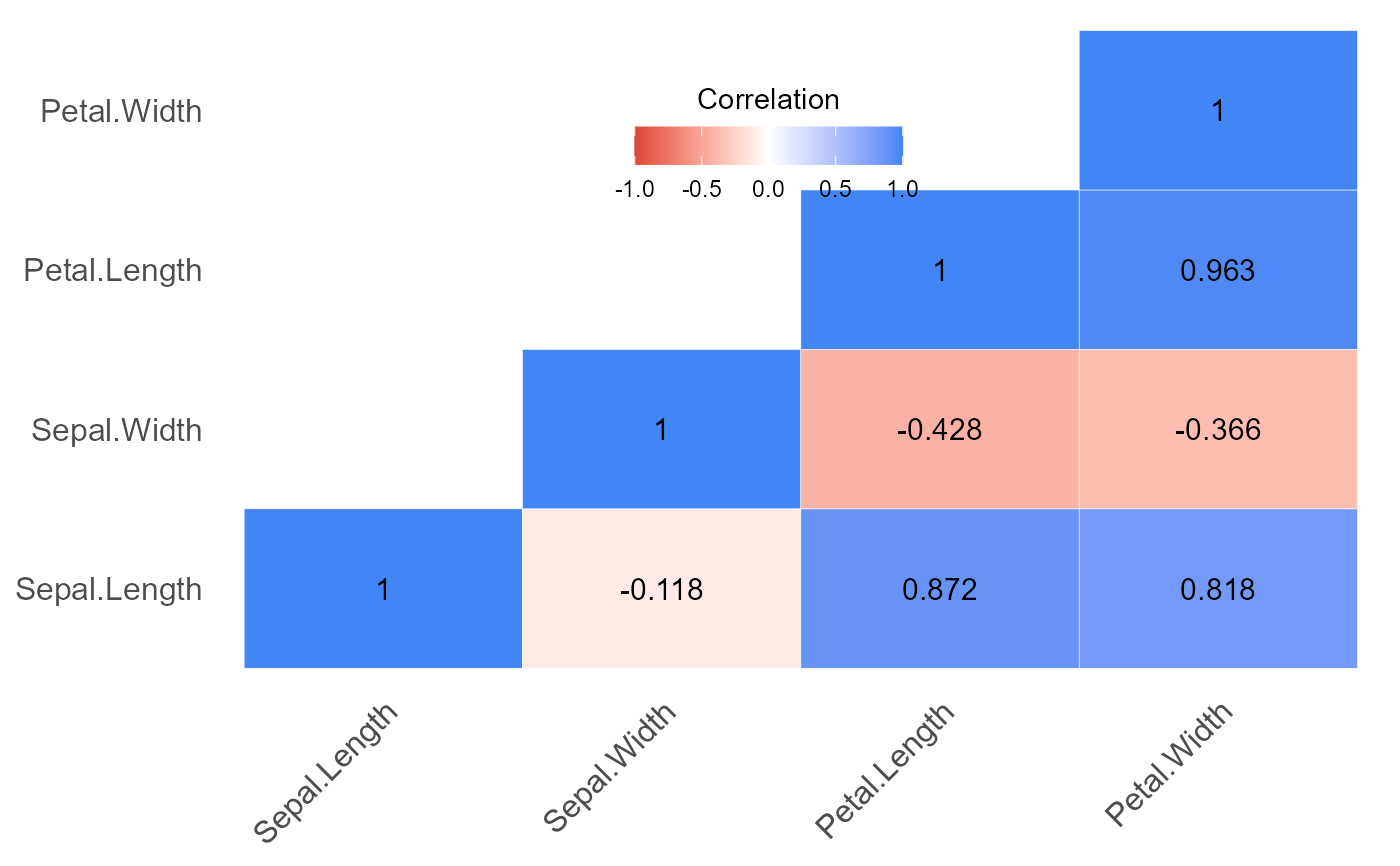
library(agriutilities)
data(iris)
M <- cor(iris[, -5])
covcor_heat(matrix = M, corr = TRUE)