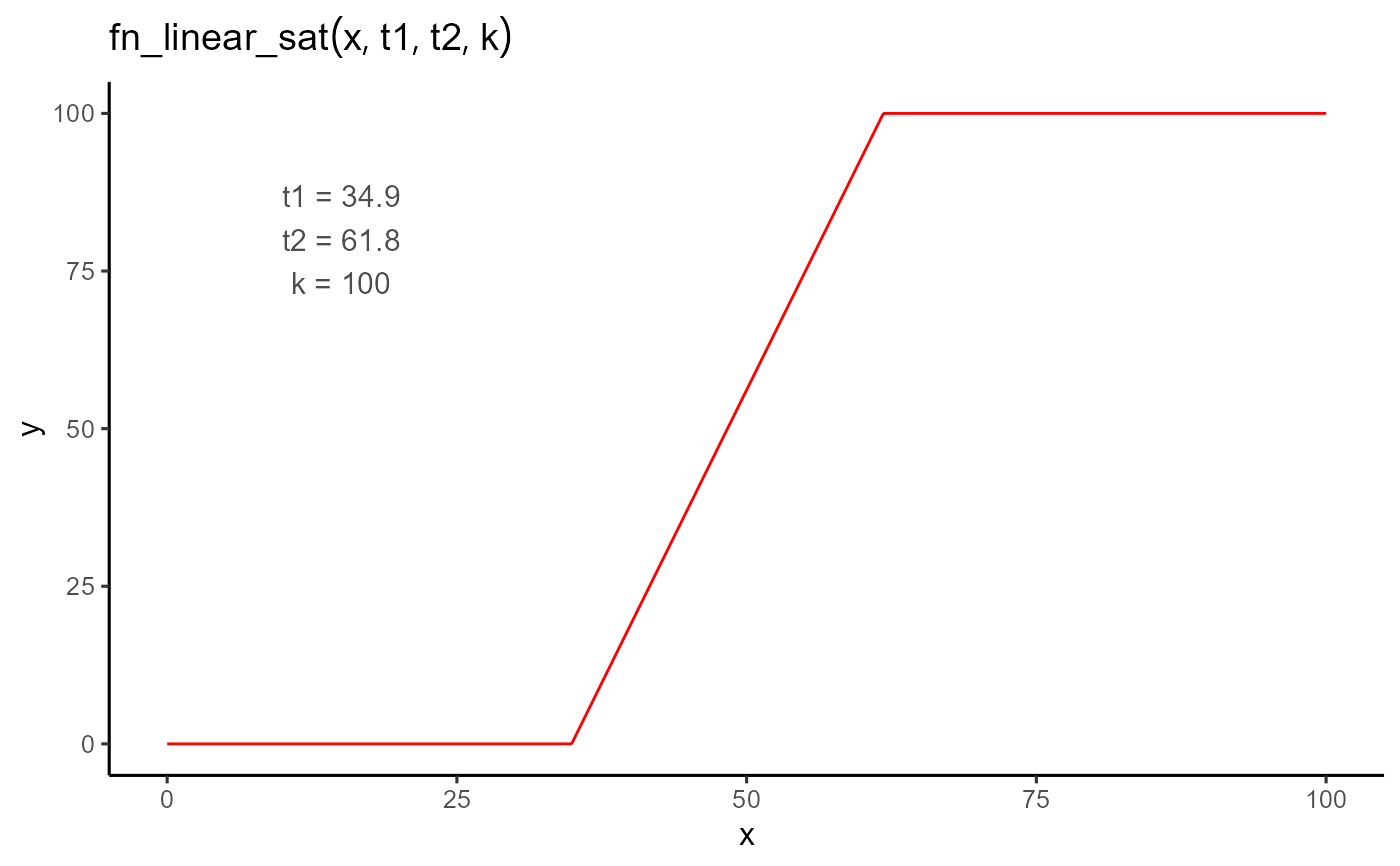
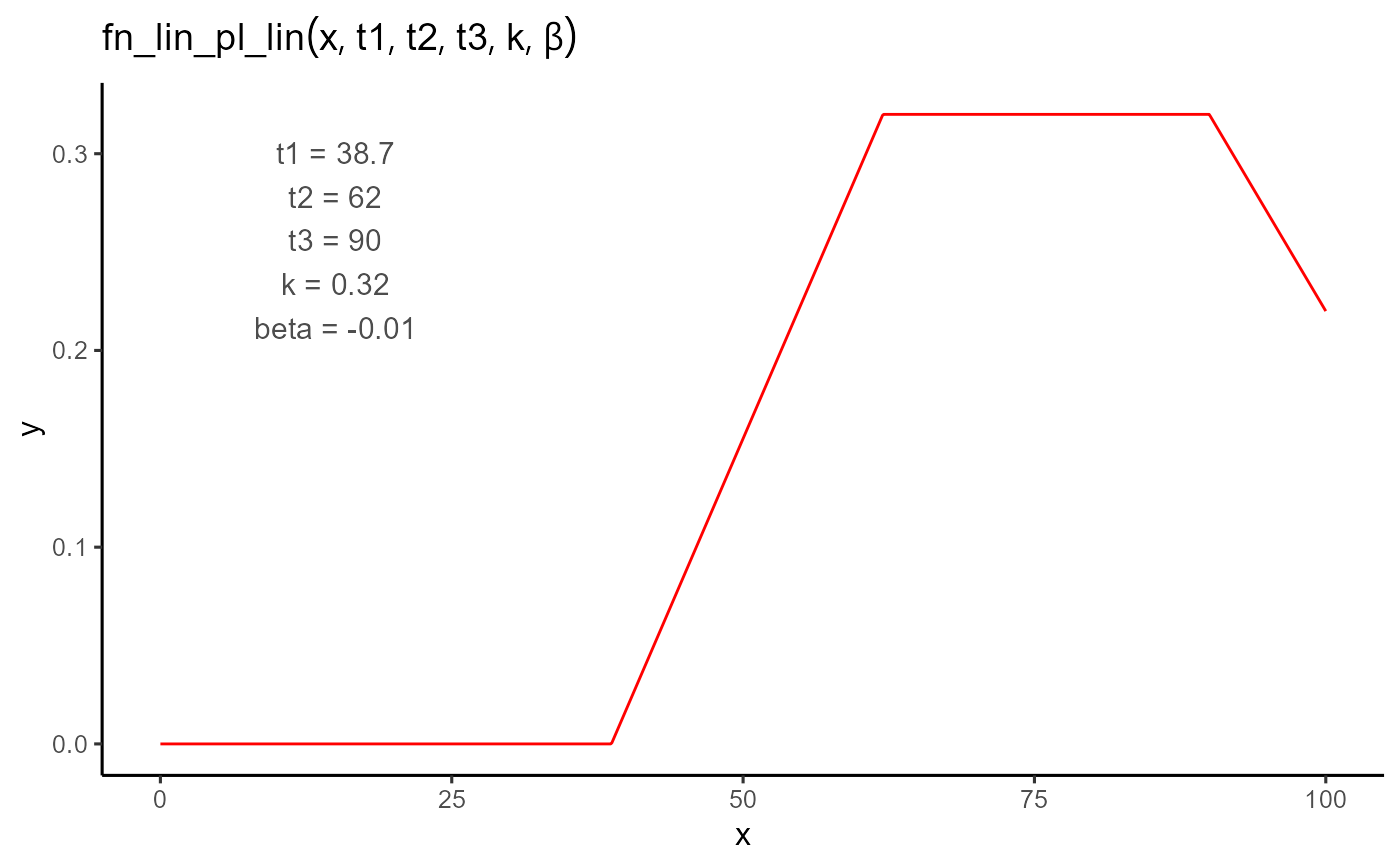
This function plots a function over a specified interval and annotates the plot with the calculated Area Under the Curve (AUC) and parameter values. The aim of `plot_fn` is to allow users to play with different starting values in their functions before fitting any models.
Arguments
- fn
A character string representing the name of the function to be plotted. Default is "fn_lin_plat".
- params
A named numeric vector of parameters to be passed to the function. Default is
c(t1 = 34.9, t2 = 61.8, k = 100).- interval
A numeric vector of length 2 specifying the interval over which the function is to be plotted. Default is
c(0, 100).- n_points
An integer specifying the number of points to be used for plotting. Default is 1000.
- auc
Print AUC in the plot? Default is
FALSE.- x_auc_label
A numeric value specifying the x-coordinate for the AUC label. Default is
NULL.- y_auc_label
A numeric value specifying the y-coordinate for the AUC label. Default is
NULL.- auc_label_size
A numeric value specifying the size of the AUC label text. Default is 3.
- param_label_size
A numeric value specifying the size of the parameter label text. Default is 3.
- base_size
A numeric value specifying the base size for the plot's theme. Default is 12.
- color
A character string specifying the color for the plot lines and area fill. Default is "red".
- label_color
A character string specifying the color for the labels. Default is "grey30".


