Plotting predictions and derivatives
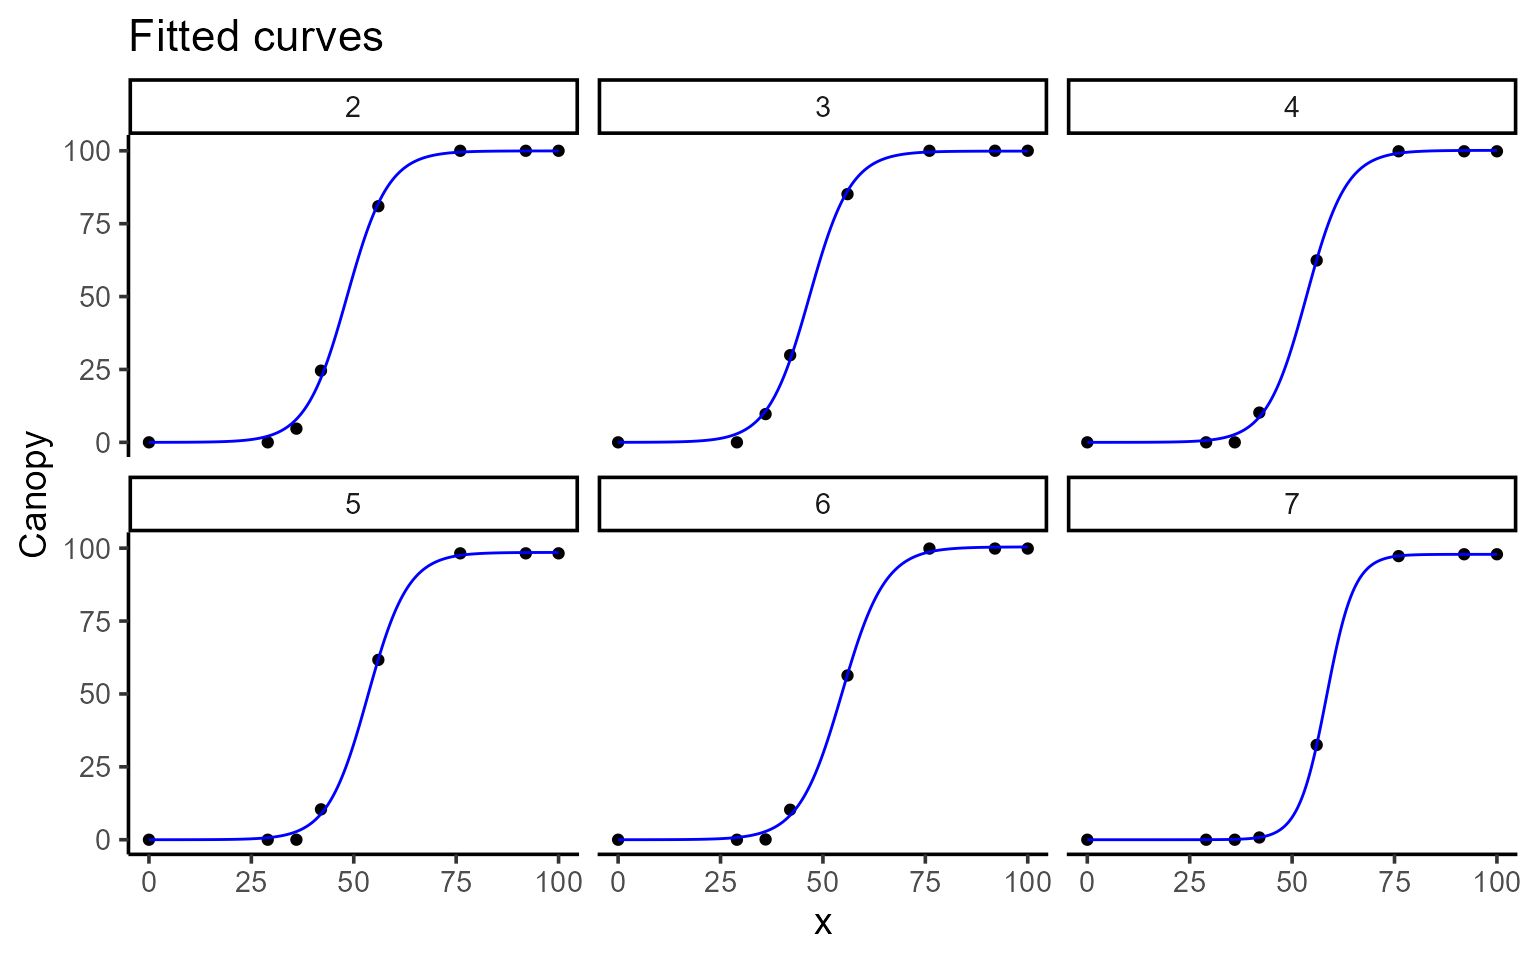
# Raw data with fitted curves
plot(mod, type = 1, color = "blue", id = plots, title = "Fitted curves")
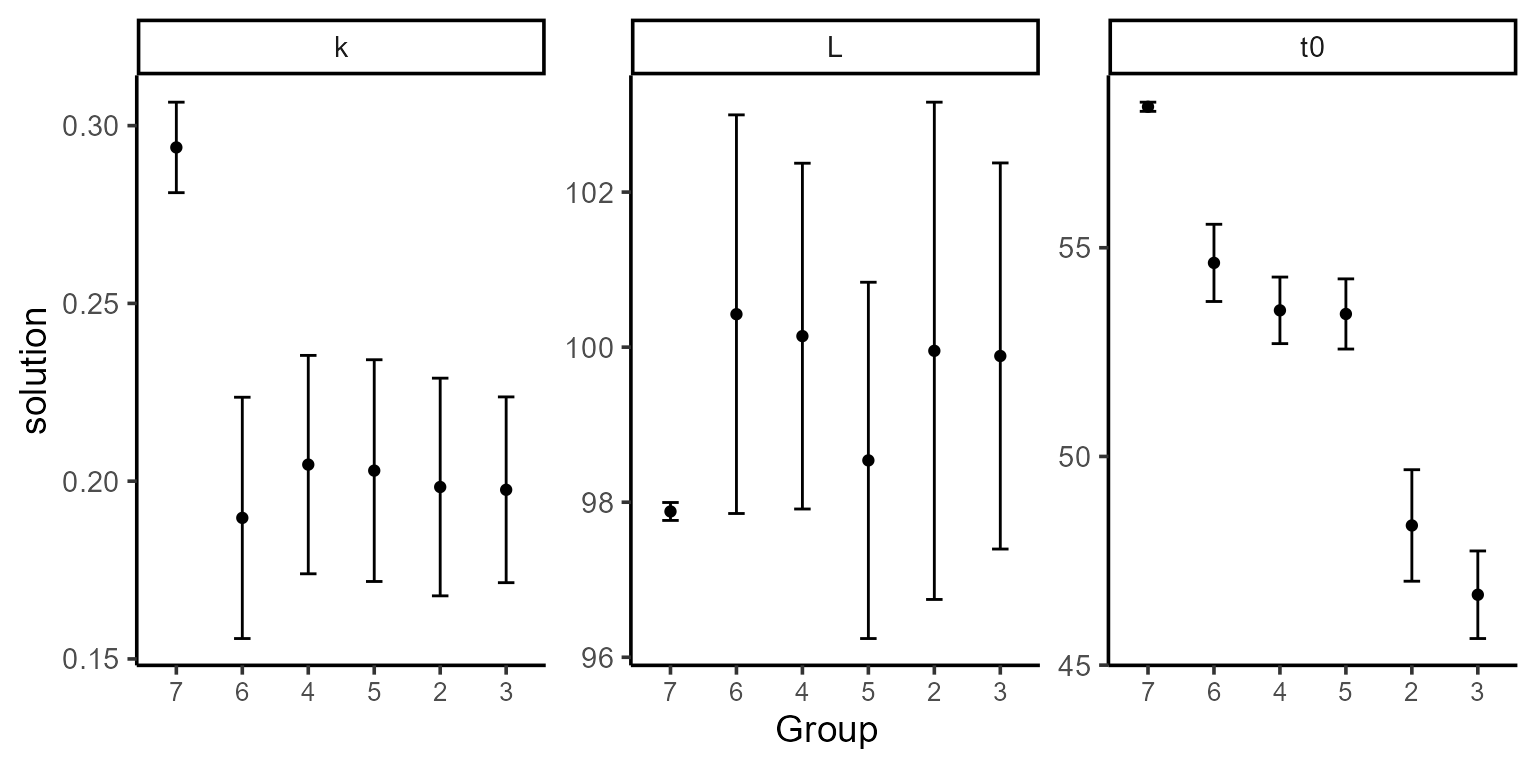
# Model coefficients
plot(mod, type = 2, color = "blue", id = plots, label_size = 10)
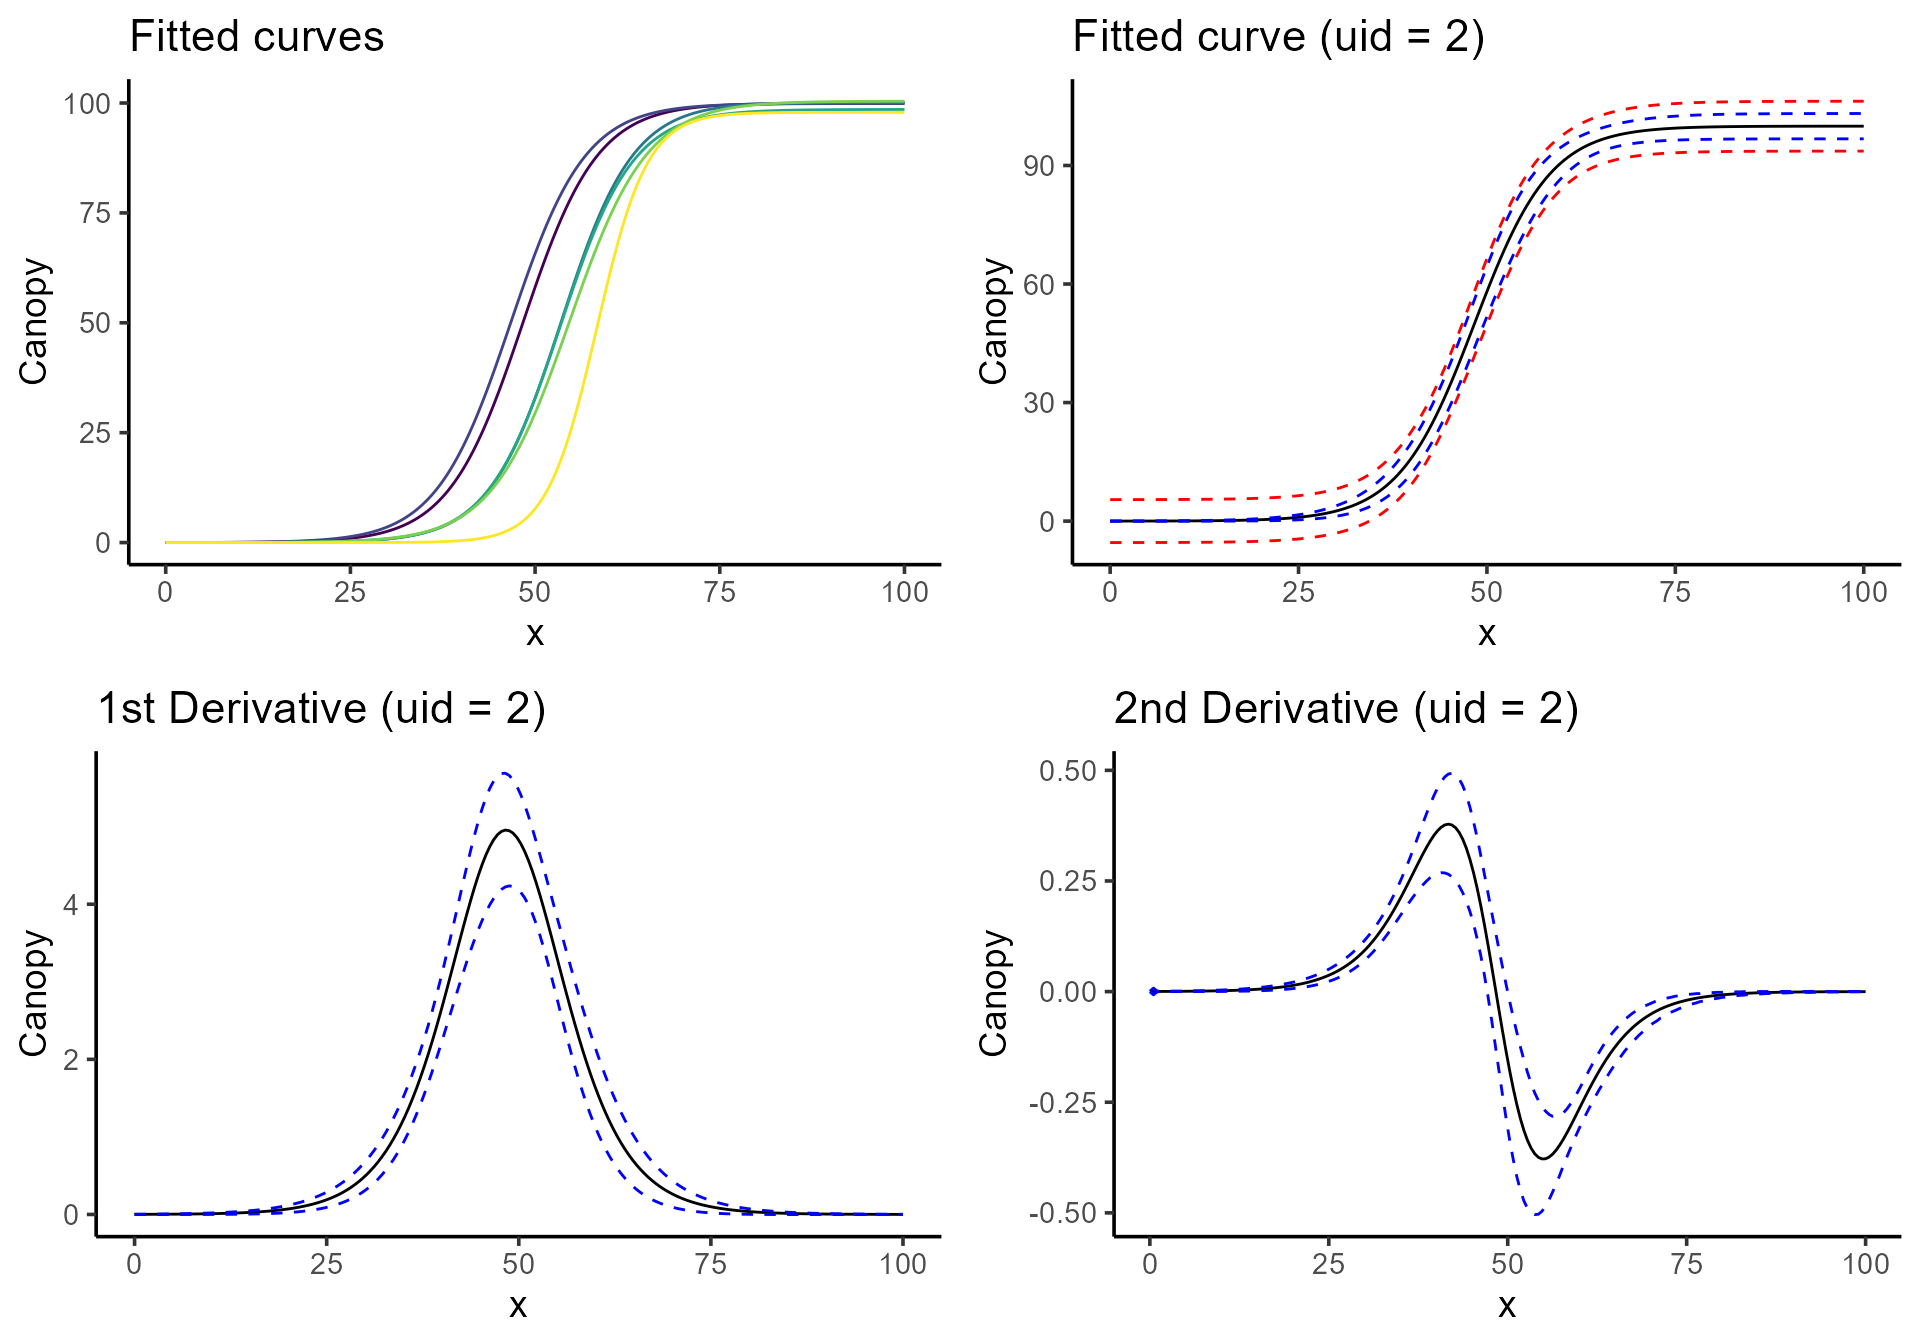
# Fitted curves only
c <- plot(mod, type = 3, color = "blue", id = plots, title = "Fitted curves")
# Fitted curves with confidence intervals
d <- plot(mod, type = 4, n_points = 200, title = "Fitted curve (uid = 2)")
# First derivative with confidence intervals
e <- plot(mod, type = 5, n_points = 200, title = "1st Derivative (uid = 2)")
# Second derivative with confidence intervals
f <- plot(mod, type = 6, n_points = 200, title = "2nd Derivative (uid = 2)")
ggarrange(c, d, e, f)