A versatile function for performing non-linear least squares optimization on grouped data. It supports customizable optimization methods, flexible initial/fixed parameters, and parallel processing.
Arguments
- data
A
data.framecontaining the input data for analysis.- x
The name of the column in
datarepresenting the independent variable (x points).- y
The name of the column in
datacontaining the dependent variable to analyze (response variable).- grp
Column(s) in
dataused as grouping variable(s). Defaults toNULL. (Optional)- keep
Names of columns to retain in the output. Defaults to
NULL. (Optional)- fn
A string. The name of the function used for curve fitting. Example:
"fn_lin". Defaults to"fn_lin_plat".- parameters
A numeric vector, named list, or
data.frameproviding initial values for parameters:- Numeric vector
Named vector specifying initial values (e.g.,
c(k = 0.5, t1 = 30)).- Data frame
Requires a
uidcolumn with group IDs and parameter values for each group.- List
Named list where parameter values can be numeric or expressions (e.g.,
list(k = "max(y)", t1 = 40)).
Defaults to
NULL.- lower
A numeric vector specifying lower bounds for parameters. Defaults to
-Inffor all parameters.- upper
A numeric vector specifying upper bounds for parameters. Defaults to
Inffor all parameters.- fixed_params
A list or
data.framefor fixing specific parameters:- List
Named list where parameter values can be numeric or expressions (e.g.,
list(k = "max(y)", t1 = 40)).- Data frame
Requires a
uidcolumn for group IDs and fixed parameter values.
Defaults to
NULL.- method
A character vector specifying optimization methods. Check available methods using
list_methods()and their dependencies usingoptimx::checkallsolvers(). Defaults toc("subplex", "pracmanm", "anms").- subset
A vector (optional) containing levels of
grpto filter the data for analysis. Defaults toNULL(all groups are included).- options
A list of additional options. See
modeler.options()progressLogical. If
TRUEa progress bar is displayed. Default isFALSE. Try this before running the function:progressr::handlers("progress", "beepr").parallelLogical. If
TRUEthe model fit is performed in parallel. Default isFALSE.workersThe number of parallel processes to use.
parallel::detectCores()traceIf
TRUE, convergence monitoring of the current fit is reported in the console.FALSEby default.return_methodLogical. If
TRUE, includes the optimization method used in the result. Default isFALSE.
- control
A list of control parameters to be passed to the optimization function. For example:
list(maxit = 500).
Value
An object of class modeler, which is a list containing the following elements:
paramData frame containing optimized parameters and related information.
dtData frame with input data, fitted values, and residuals.
metricsMetrics and summary of the models.
executionTotal execution time for the analysis.
responseName of the response variable analyzed.
keepMetadata retained based on the
keepargument.funName of the curve-fitting function used.
parallelList containing parallel execution details (if applicable).
fitList of fitted models for each group.
Examples
library(flexFitR)
data(dt_potato)
explorer <- explorer(dt_potato, x = DAP, y = c(Canopy, GLI), id = Plot)
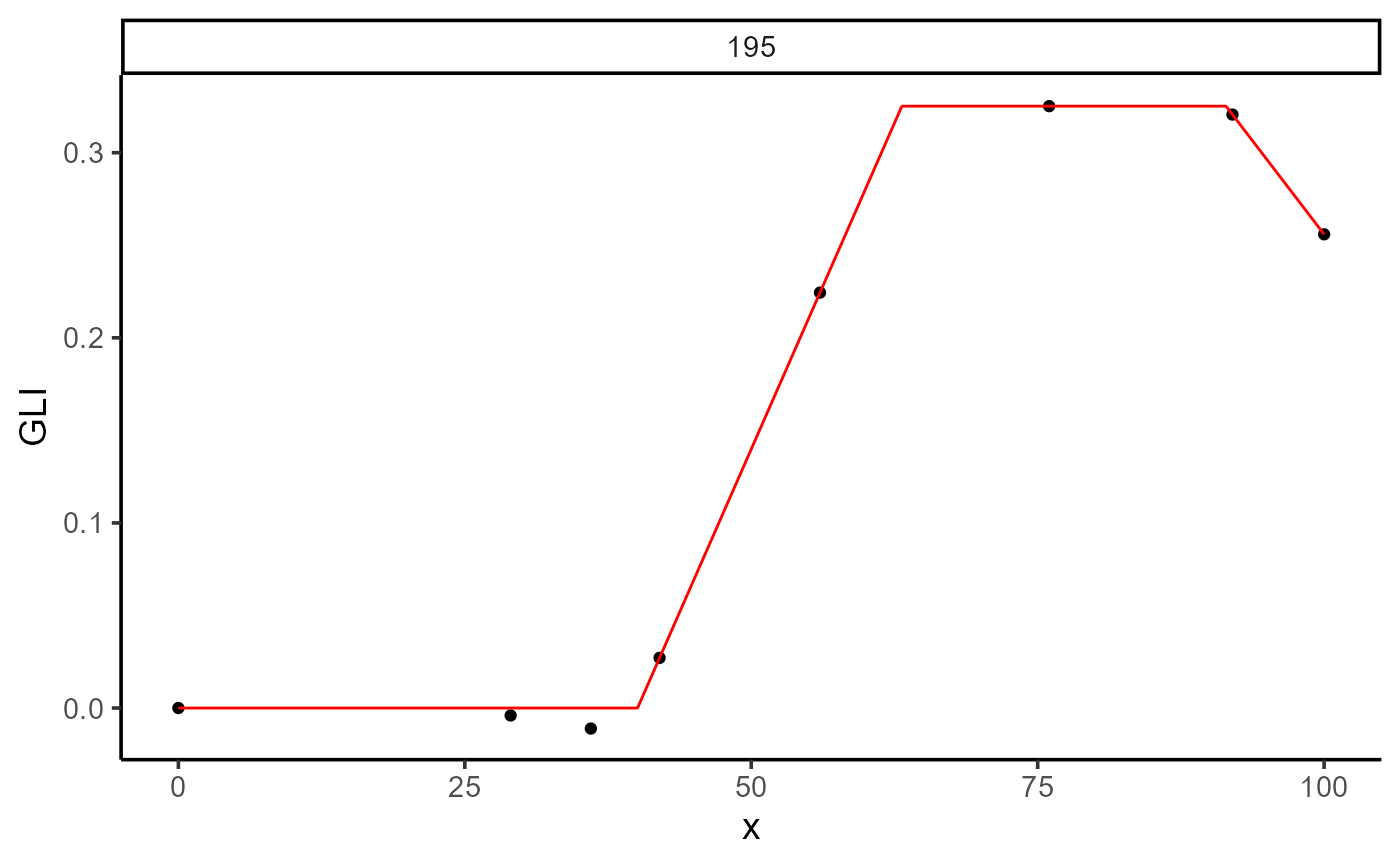
# Example 1
mod_1 <- dt_potato |>
modeler(
x = DAP,
y = GLI,
grp = Plot,
fn = "fn_lin_pl_lin",
parameters = c(t1 = 38.7, t2 = 62, t3 = 90, k = 0.32, beta = -0.01),
subset = 195
)
plot(mod_1, id = 195)
 print(mod_1)
#>
#> Call:
#> GLI ~ fn_lin_pl_lin(DAP, t1, t2, t3, k, beta)
#>
#> Residuals (`Standardized`):
#> Min. 1st Qu. Median Mean 3rd Qu. Max.
#> -1.629e+00 -1.474e-01 0.000e+00 -2.773e-01 0.000e+00 4.000e-08
#>
#> Optimization Results `head()`:
#> uid t1 t2 t3 k beta sse
#> 195 40.1 63.1 91.4 0.325 -0.00809 0.000139
#>
#> Metrics:
#> Groups Timing Convergence Iterations
#> 1 0.4491 secs 100% 3156 (id)
#>
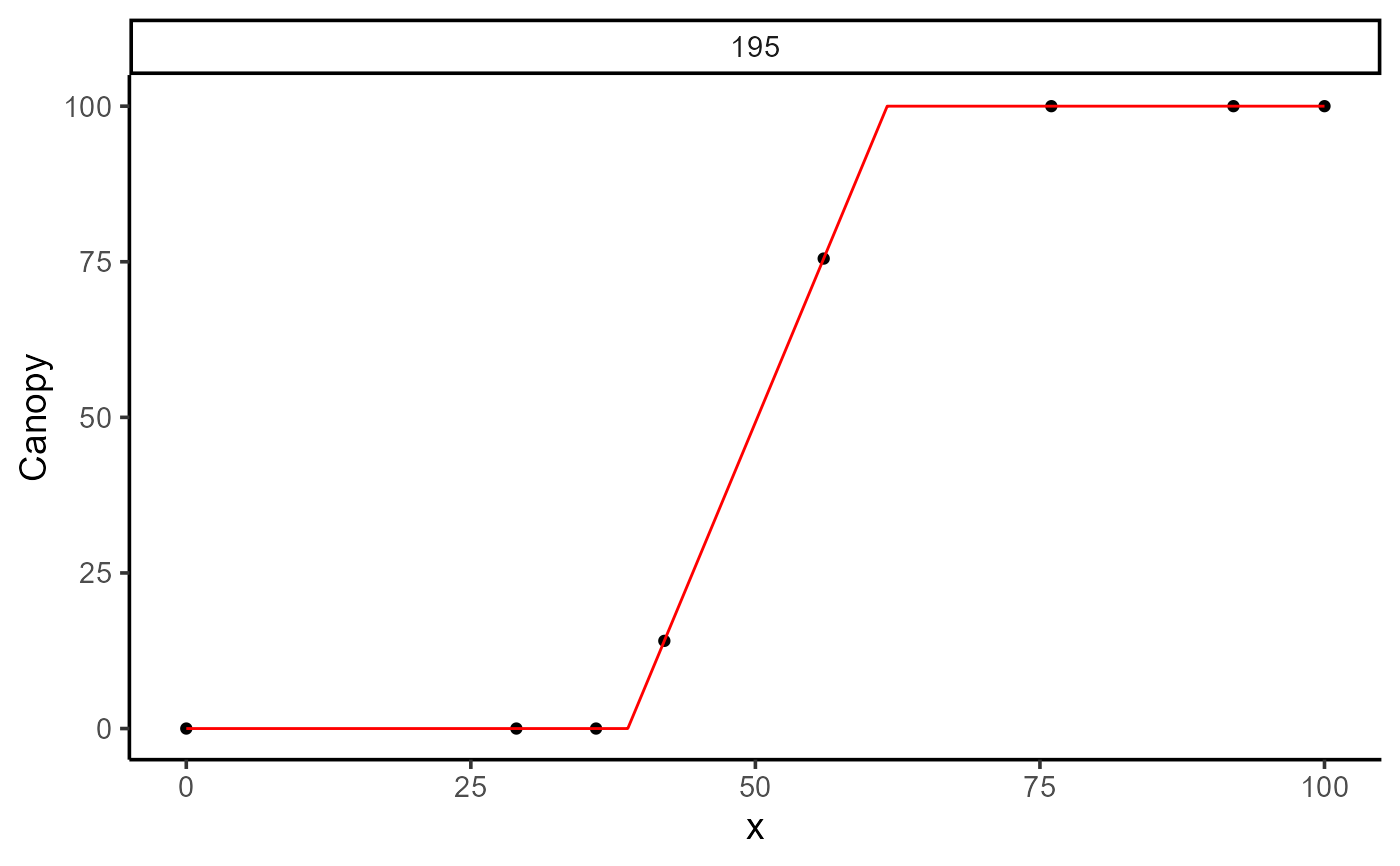
# Example 2
mod_2 <- dt_potato |>
modeler(
x = DAP,
y = Canopy,
grp = Plot,
fn = "fn_lin_plat",
parameters = c(t1 = 45, t2 = 80, k = 0.9),
subset = 195
)
plot(mod_2, id = 195)
print(mod_1)
#>
#> Call:
#> GLI ~ fn_lin_pl_lin(DAP, t1, t2, t3, k, beta)
#>
#> Residuals (`Standardized`):
#> Min. 1st Qu. Median Mean 3rd Qu. Max.
#> -1.629e+00 -1.474e-01 0.000e+00 -2.773e-01 0.000e+00 4.000e-08
#>
#> Optimization Results `head()`:
#> uid t1 t2 t3 k beta sse
#> 195 40.1 63.1 91.4 0.325 -0.00809 0.000139
#>
#> Metrics:
#> Groups Timing Convergence Iterations
#> 1 0.4491 secs 100% 3156 (id)
#>
# Example 2
mod_2 <- dt_potato |>
modeler(
x = DAP,
y = Canopy,
grp = Plot,
fn = "fn_lin_plat",
parameters = c(t1 = 45, t2 = 80, k = 0.9),
subset = 195
)
plot(mod_2, id = 195)
 print(mod_2)
#>
#> Call:
#> Canopy ~ fn_lin_plat(DAP, t1, t2, k)
#>
#> Residuals (`Standardized`):
#> Min. 1st Qu. Median Mean 3rd Qu. Max.
#> -1.6489 0.0000 0.2623 0.1414 0.5246 1.2064
#>
#> Optimization Results `head()`:
#> uid t1 t2 k sse
#> 195 38.8 61.6 100 2.65e-18
#>
#> Metrics:
#> Groups Timing Convergence Iterations
#> 1 0.1993 secs 100% 351 (id)
#>
print(mod_2)
#>
#> Call:
#> Canopy ~ fn_lin_plat(DAP, t1, t2, k)
#>
#> Residuals (`Standardized`):
#> Min. 1st Qu. Median Mean 3rd Qu. Max.
#> -1.6489 0.0000 0.2623 0.1414 0.5246 1.2064
#>
#> Optimization Results `head()`:
#> uid t1 t2 k sse
#> 195 38.8 61.6 100 2.65e-18
#>
#> Metrics:
#> Groups Timing Convergence Iterations
#> 1 0.1993 secs 100% 351 (id)
#>