Explores data from a data frame in wide format.
Arguments
- data
A
data.framecontaining the input data for analysis.- x
The name of the column in
datathat contains x points.- y
The names of the columns in
datathat contain the variables to be analyzed.- id
The names of the columns in
datathat contains a grouping variable.- metadata
The names of the columns in
datato keep across the analysis.
Value
An object of class explorer, which is a list containing the following elements:
summ_varsA data.frame containing summary statistics for each trait at each x point, including minimum, mean, median, maximum, standard deviation, coefficient of variation, number of non-missing values, percentage of missing values, and percentage of negative values.
summ_metadataA data.frame summarizing the metadata.
locals_min_maxA data.frame containing the local minima and maxima of the mean y values over x.
dt_longA data.frame in long format, with columns for uid, metadata, var, x, and y
metadataA character vector with the names of the variables to keep across.
Details
This function helps to explore the dataset before being analyzed with modeler().
Examples
library(flexFitR)
data(dt_potato)
results <- dt_potato |>
  explorer(
    x = DAP,
    y = c(Canopy, GLI),
    id = Plot,
    metadata = c(gid, Row, Range)
  )
names(results)
#> [1] "summ_vars"      "summ_metadata"  "locals_min_max" "dt_long"
#> [5] "metadata"       "x_var"
head(results$summ_vars)
#> # A tibble: 6 × 12
#>   var        x    Min  Mean Median   Max    SD       CV     n  miss `miss%`
#>   <chr>  <dbl>  <dbl> <dbl>  <dbl> <dbl> <dbl>    <dbl> <int> <int>   <dbl>
#> 1 Canopy     0  0      0      0      0    0    NaN        196     0       0
#> 2 Canopy    29  0      0      0      0    0    NaN        196     0       0
#> 3 Canopy    36  0      2.95   1.84  15.1  3.22   1.09     196     0       0
#> 4 Canopy    42  0.763 23.4   22.9   46.2  9.31   0.398    196     0       0
#> 5 Canopy    56 32.5   75.2   75.0   98.6 12.3    0.163    196     0       0
#> 6 Canopy    76 89.1   99.7  100    100    1.04   0.0104   196     0       0
#> # ℹ 1 more variable: `neg%` <dbl>
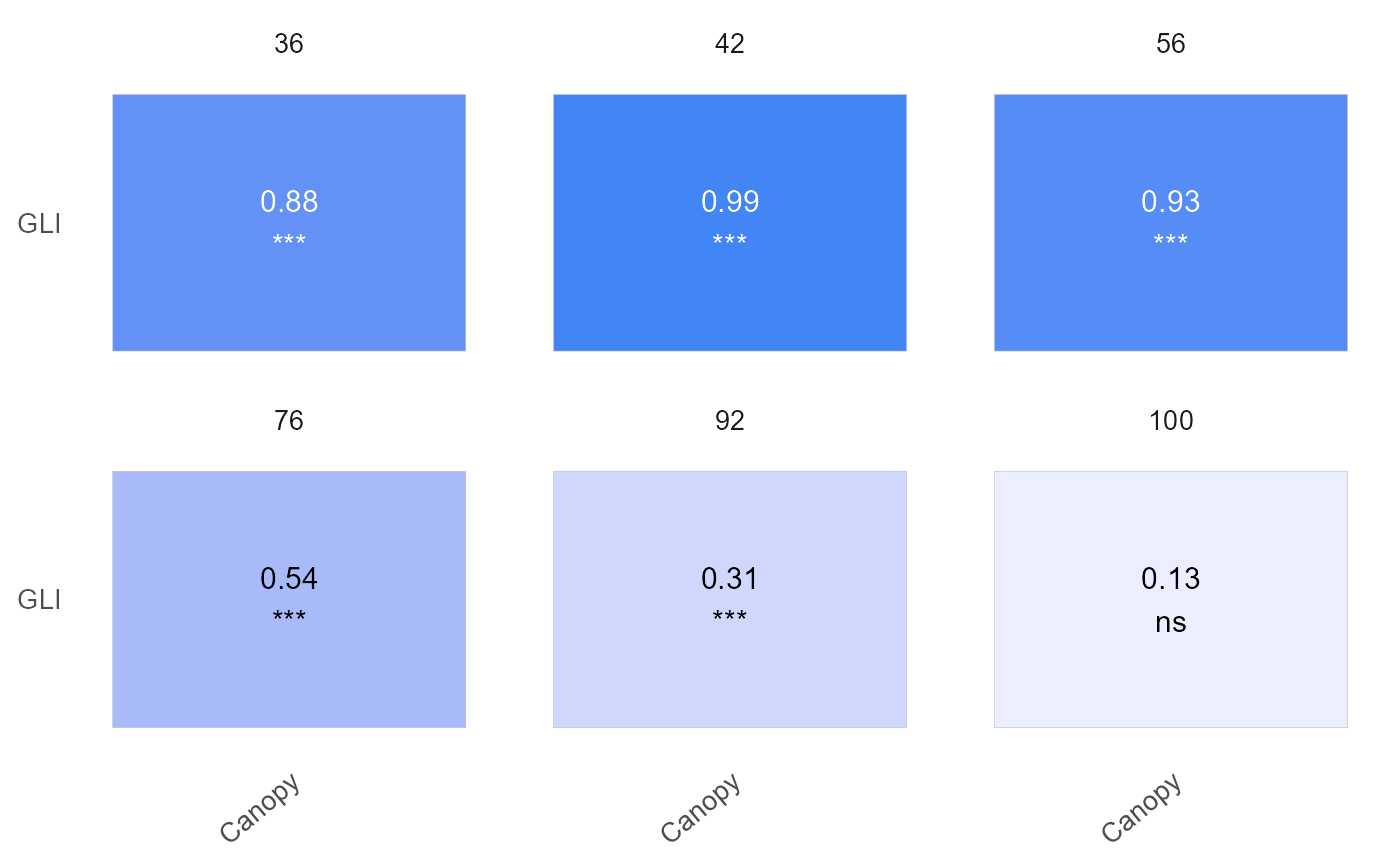
plot(results, label_size = 4, signif = TRUE, n_row = 2)

# New data format
head(results$dt_long)
#> # A tibble: 6 × 7
#>     uid gid         Row Range var        x         y
#>   <dbl> <chr>     <dbl> <dbl> <chr>  <dbl>     <dbl>
#> 1     1 W17037-24     1     1 Canopy     0  0
#> 2     1 W17037-24     1     1 GLI        0  0
#> 3     1 W17037-24     1     1 Canopy    29  0
#> 4     1 W17037-24     1     1 GLI       29  0.00272
#> 5     1 W17037-24     1     1 Canopy    36  0.67
#> 6     1 W17037-24     1     1 GLI       36 -0.000897
