Perform an extra sum-of-squares F-test to compare two nested
models of class modeler. This test assesses whether the additional
parameters in the full model significantly improve the fit compared to the
reduced model.
Usage
# S3 method for class 'modeler'
anova(object, full_model = NULL, ...)Value
A tibble containing columns with the F-statistic and
corresponding p-values, indicating whether the full model provides a
significantly better fit than the reduced model.
Examples
library(flexFitR)
dt <- data.frame(X = 1:6, Y = c(12, 16, 44, 50, 95, 100))
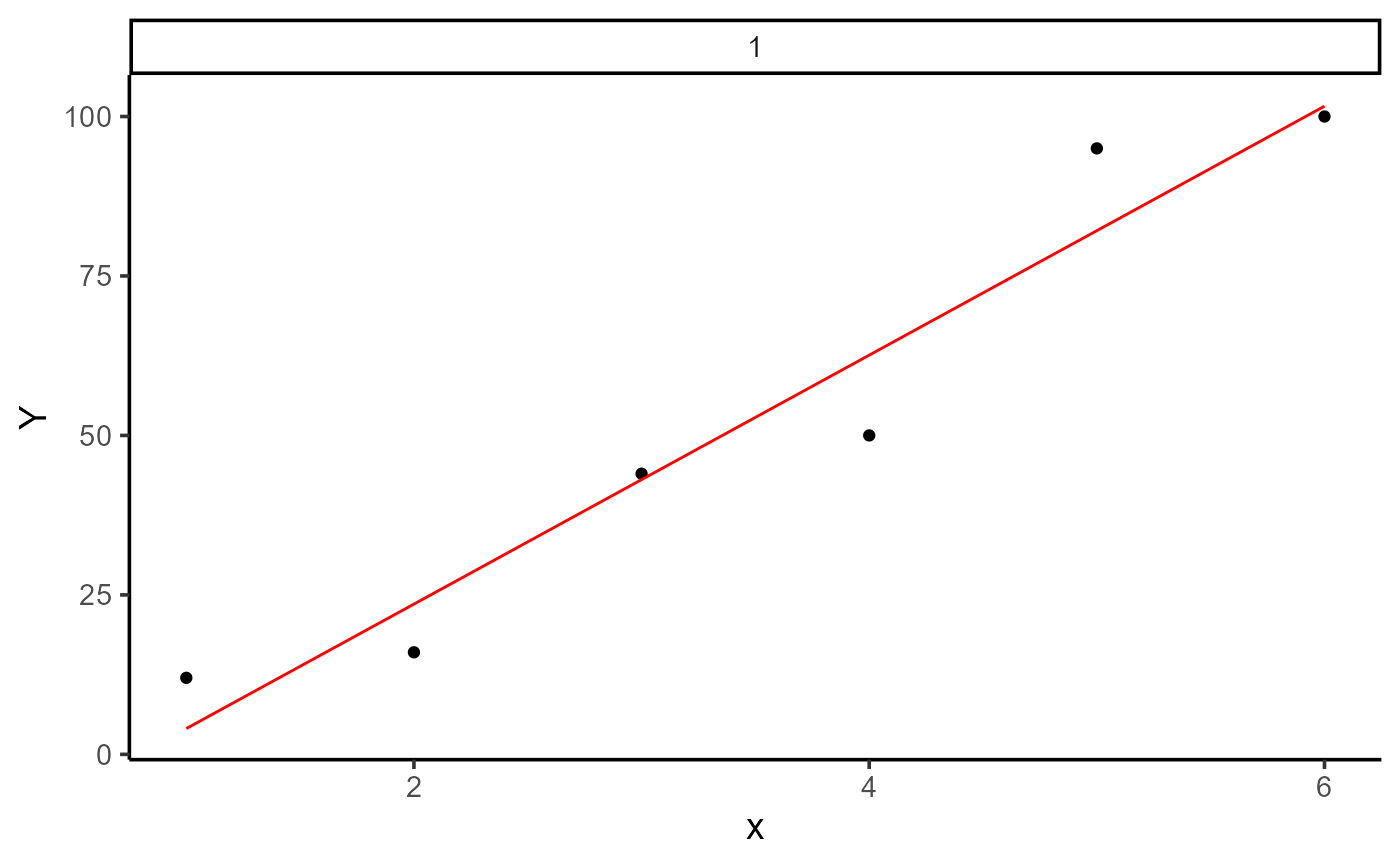
mo_1 <- modeler(dt, X, Y, fn = "fn_lin", param = c(m = 10, b = -5))
plot(mo_1)

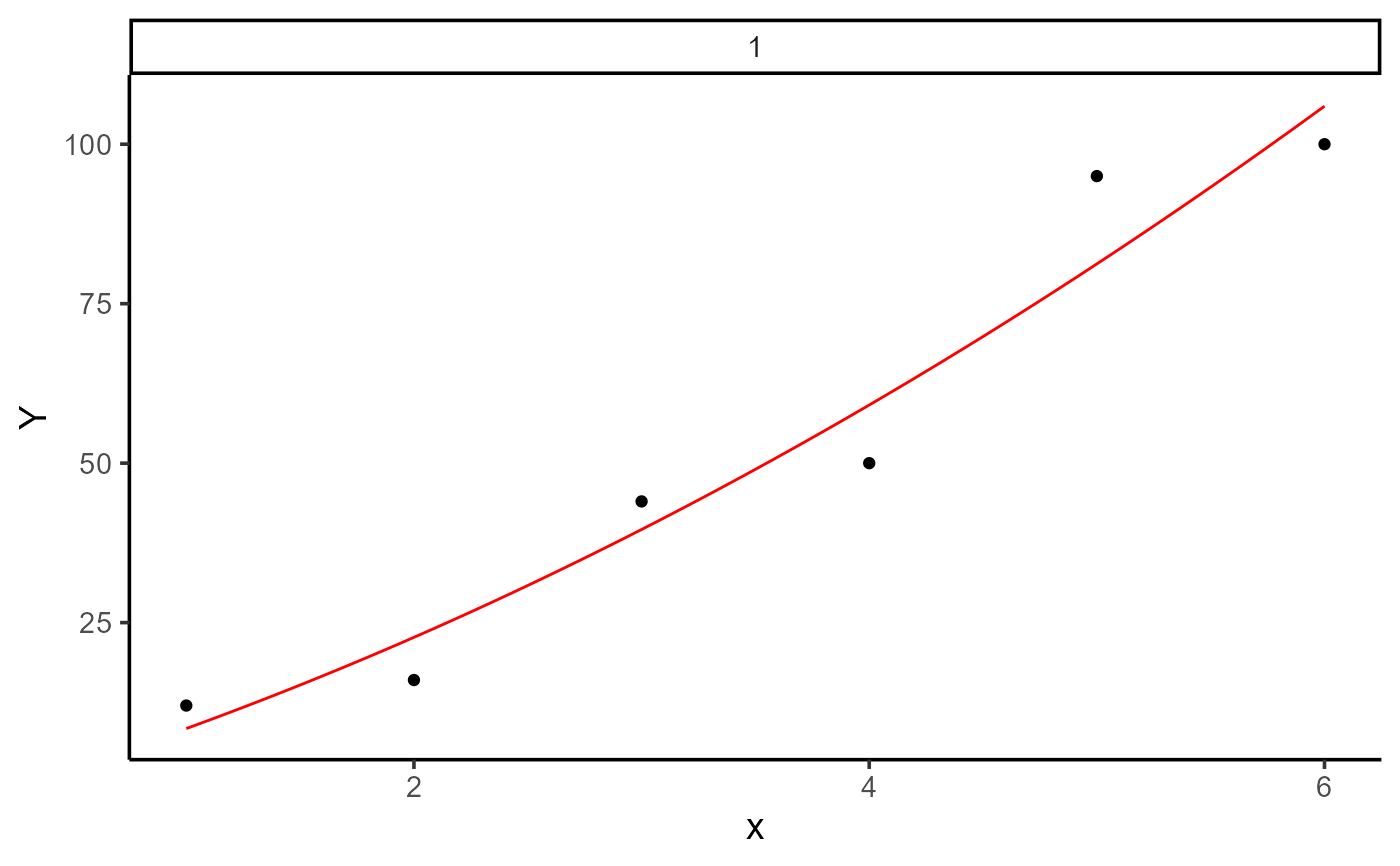
mo_2 <- modeler(dt, X, Y, fn = "fn_quad", param = c(a = 1, b = 10, c = 5))
plot(mo_2)

anova(mo_1, mo_2)
#> # A tibble: 1 × 9
#>     uid RSS_reduced RSS_full     n   df1   df2     F `Pr(>F)` .
#>   <dbl>       <dbl>    <dbl> <int> <int> <int> <dbl>    <dbl> <fct>
#> 1     1        449.     385.     6     1     3 0.494    0.533 ns
