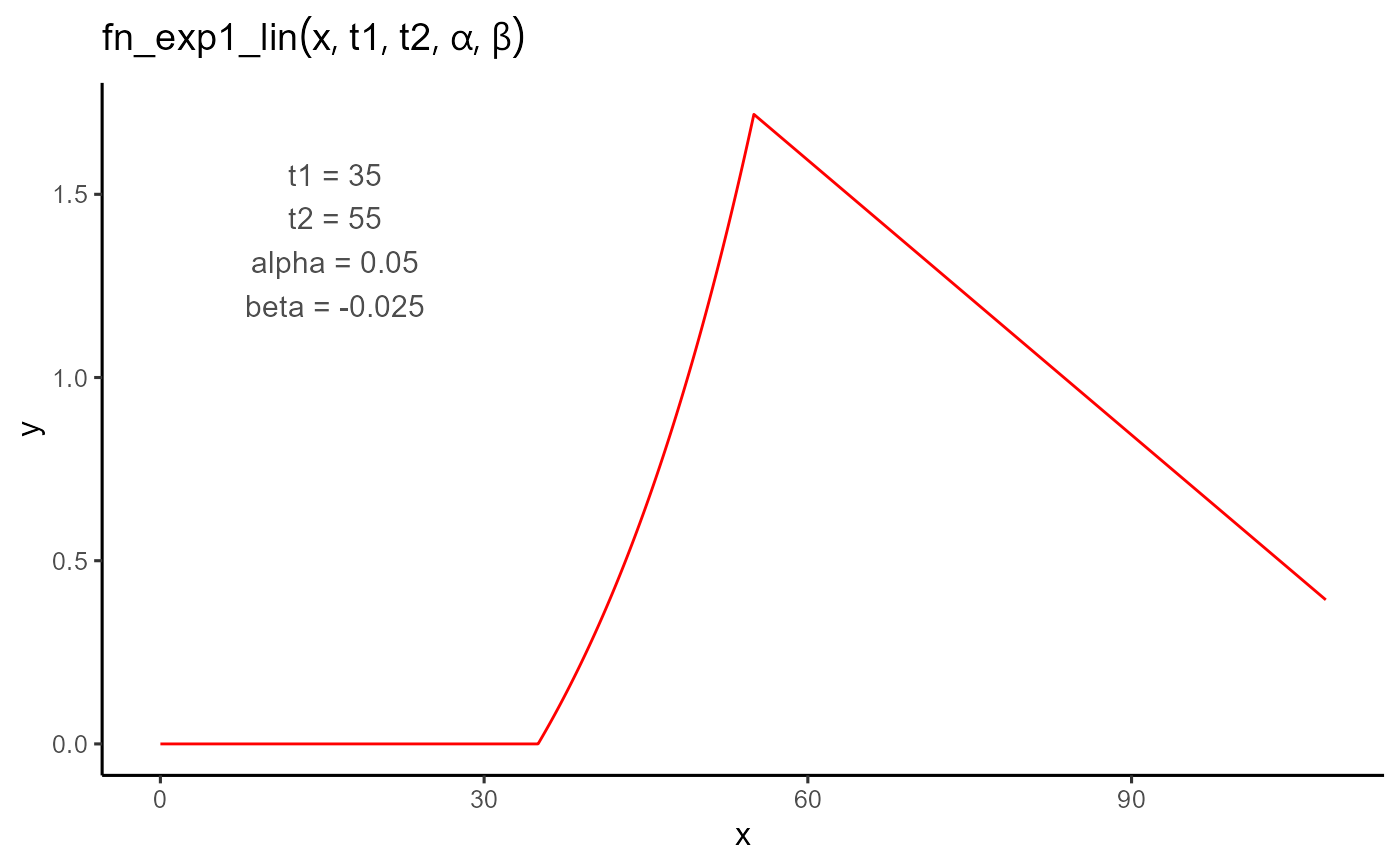
Computes a value based on an exponential growth curve and linear decay model for time.
Usage
fn_exp1_lin(t, t1, t2, alpha, beta)
Arguments
- t
Numeric. The time value.
- t1
Numeric. The lower threshold time. Assumed to be known.
- t2
Numeric. The upper threshold time.
- alpha
Numeric. The parameter for the exponential term. Must be greater
than 0.
- beta
Numeric. The parameter for the linear term. Must be less than 0.
Value
A numeric value based on the exponential linear model.
If t is less than t1, the function returns 0.
If t is between t1 and t2 (inclusive),
the function returns exp(alpha * (t - t1)) - 1.
If t is greater than t2, the function returns
beta * (t - t2) + (exp(alpha * (t2 - t1)) - 1).
Details
$$
f(t; t_1, t_2, \alpha, \beta) =
\begin{cases}
0 & \text{if } t < t_1 \\
e^{\alpha \cdot (t - t_1)} - 1 & \text{if } t_1 \leq t \leq t_2 \\
\beta \cdot (t - t_2) + \left(e^{\alpha \cdot (t_2 - t_1)} - 1\right) & \text{if } t > t_2
\end{cases}
$$
Examples
library(flexFitR)
plot_fn(
  fn = "fn_exp1_lin",
  params = c(t1 = 35, t2 = 55, alpha = 1 / 20, beta = -1 / 40),
  interval = c(0, 108),
  n_points = 2000,
  auc_label_size = 3
)


