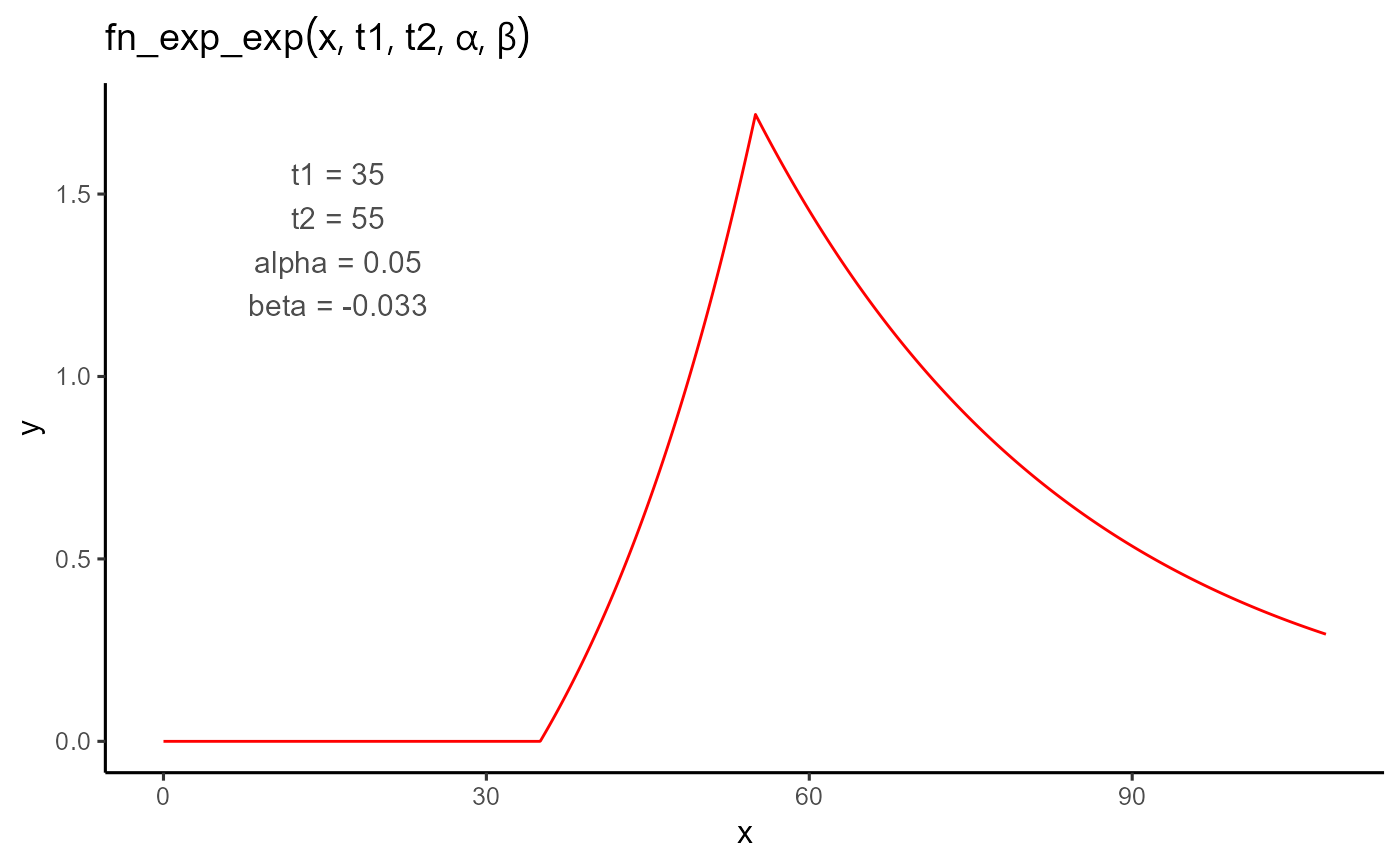
A piecewise function with two exponential phases. The first exponential phase
occurs between t1 and t2, and the second phase continues after
t2 with a potentially different growth rate. The function ensures
continuity at the transition point but not necessarily smoothness (in derivative).
Arguments
- t
A numeric vector of input values (e.g., time).
- t1
The onset time of the response. The function is 0 for all values less than
t1.- t2
The transition time between the two exponential phases. Must be greater than
t1.- alpha
The exponential growth rate during the first phase (
t1tot2).- beta
The exponential growth rate after
t2.
Details
$$ f(t; t_1, t_2, \alpha, \beta) = \begin{cases} 0 & \text{if } t < t_1 \\ e^{\alpha \cdot (t - t_1)} - 1 & \text{if } t_1 \leq t \leq t_2 \\ \left(e^{\alpha \cdot (t_2 - t_1)} - 1\right) \cdot e^{\beta \cdot (t - t_2)} & \text{if } t > t_2 \end{cases} $$
The function rises from 0 starting at t1 with exponential growth rate
alpha, and transitions to a second exponential phase with rate
beta at t2. The value at the transition point is preserved,
ensuring continuity.