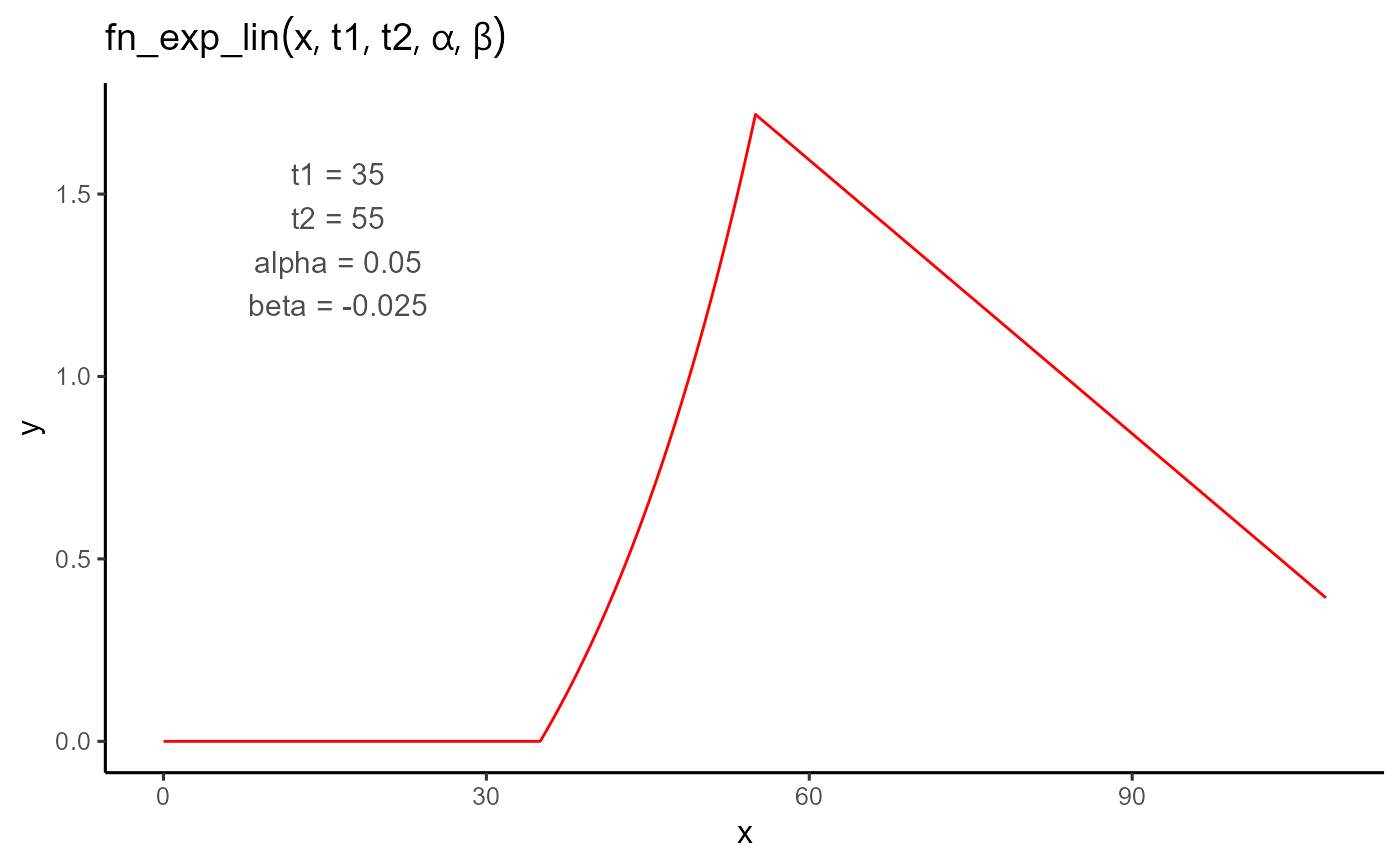
A piecewise function that models a response with an initial exponential growth phase followed by a linear phase. Commonly used to describe processes with rapid early increases that slow into a linear trend, while maintaining continuity.
Arguments
- t
A numeric vector of input values (e.g., time).
- t1
The onset time of the response. The function is 0 for all values less than
t1.- t2
The transition time between exponential and linear phases. Must be greater than
t1.- alpha
The exponential growth rate during the exponential phase.
- beta
The slope of the linear phase after
t2.
Details
$$ f(t; t_1, t_2, \alpha, \beta) = \begin{cases} 0 & \text{if } t < t_1 \\ e^{\alpha \cdot (t - t_1)} - 1 & \text{if } t_1 \leq t \leq t_2 \\ \beta \cdot (t - t_2) + \left(e^{\alpha \cdot (t_2 - t_1)} - 1\right) & \text{if } t > t_2 \end{cases} $$
The exponential segment starts from 0 at t1, and the linear segment
continues smoothly from the end of the exponential part. This ensures value
continuity at t2, but not necessarily smoothness in slope.