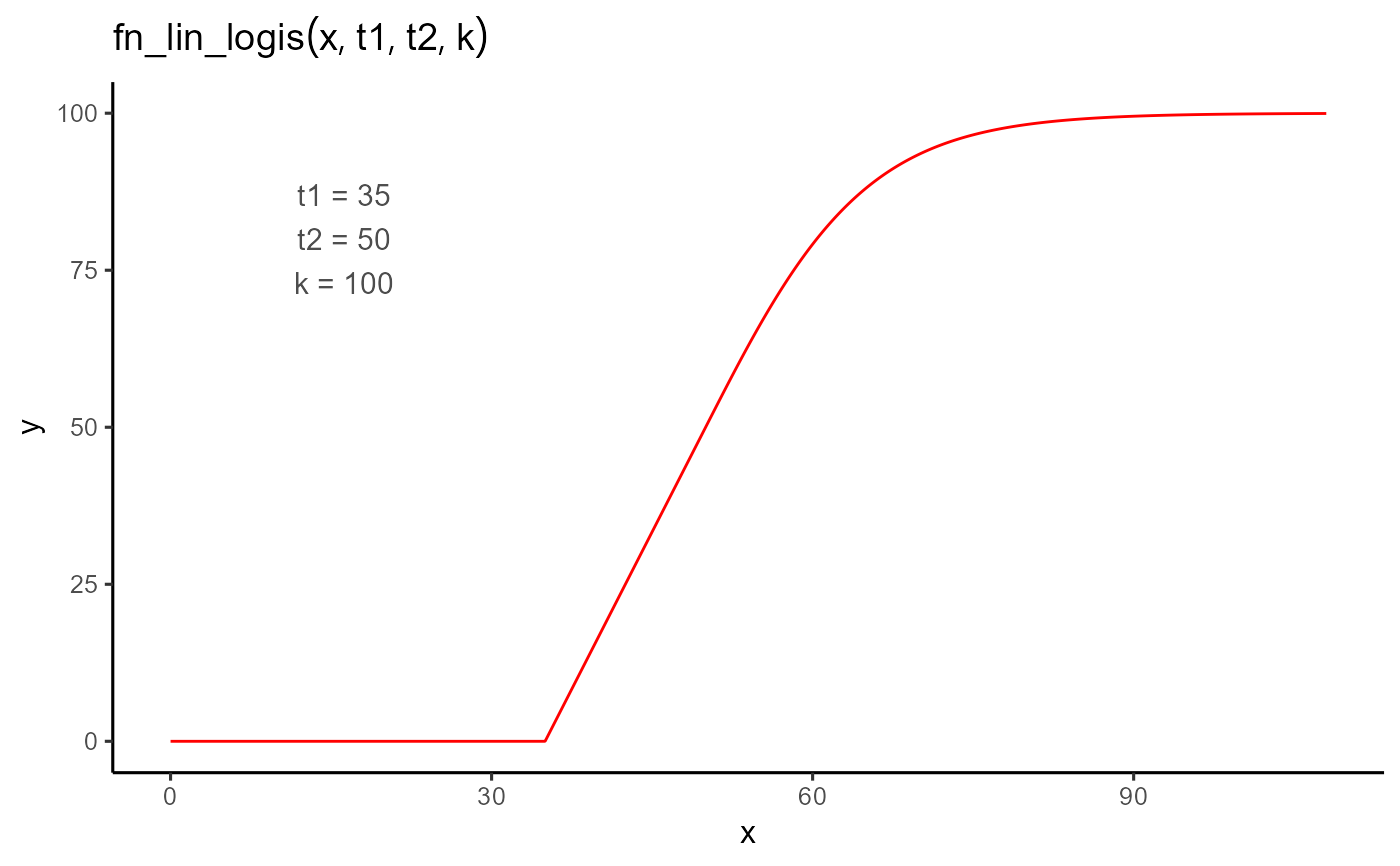
A piecewise function that models an initial linear increase followed by a logistic saturation.
Arguments
- t
A numeric vector of input values (e.g., time).
- t1
The onset time of the response. The function is 0 for all values less than
t1.- t2
The transition time between the linear and logistic phases. Must be greater than
t1.- k
The plateau height. The function transitions toward this value in the logistic phase.
Details
$$ f(t; t_1, t_2, k) = \begin{cases} 0 & \text{if } t < t_1 \\ \dfrac{k}{2(t_2 - t_1)} \cdot (t - t_1) & \text{if } t_1 \leq t \leq t_2 \\ \dfrac{k}{1 + e^{-2(t - t_2) / (t_2 - t_1)}} & \text{if } t > t_2 \end{cases} $$
The linear segment rises from 0 starting at t1, and the logistic segment begins at t2,
smoothly approaching the plateau value k.