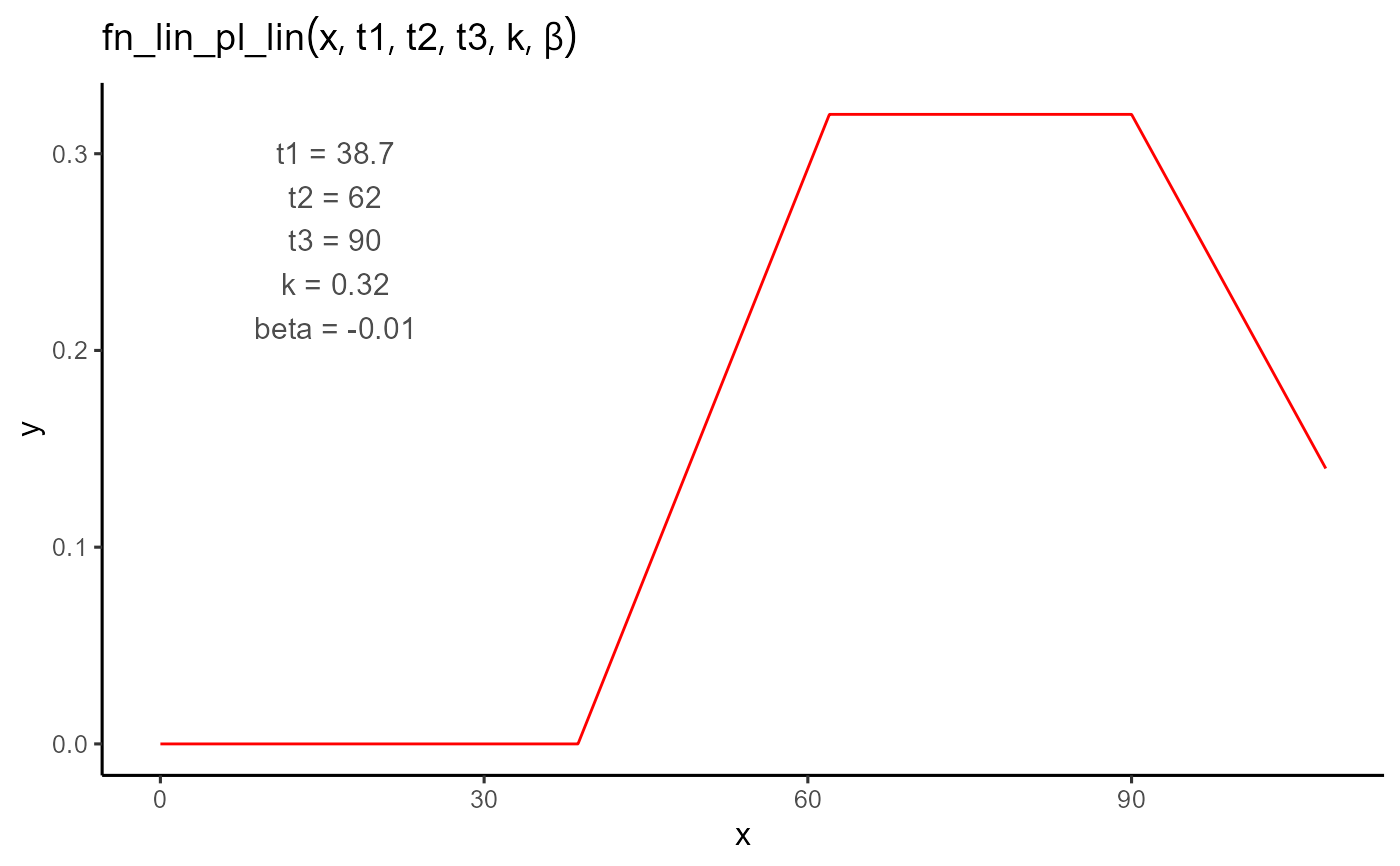
A piecewise function that models an initial linear increase up to a plateau, maintains that plateau for a duration, and then decreases linearly.
Arguments
- t
A numeric vector of input values (e.g., time).
- t1
The onset time of the response. The function is 0 for all values less than
t1.- t2
The time when the linear growth phase ends and the plateau begins. Must be greater than
t1.- t3
The time when the plateau ends and the linear decline begins. Must be greater than
t2.- k
The height of the plateau. The first linear phase increases to this value, which remains constant until
t3.- beta
The slope of the final linear phase (typically negative), controlling the rate of decline after
t3.
Details
$$ f(t; t_1, t_2, t_3, k, \beta) = \begin{cases} 0 & \text{if } t < t_1 \\ \dfrac{k}{t_2 - t_1} \cdot (t - t_1) & \text{if } t_1 \leq t \leq t_2 \\ k & \text{if } t_2 \leq t \leq t_3 \\ k + \beta \cdot (t - t_3) & \text{if } t > t_3 \end{cases} $$
The function transitions continuously between all three phases but is not
differentiable at the transition points t1, t2, and t3.