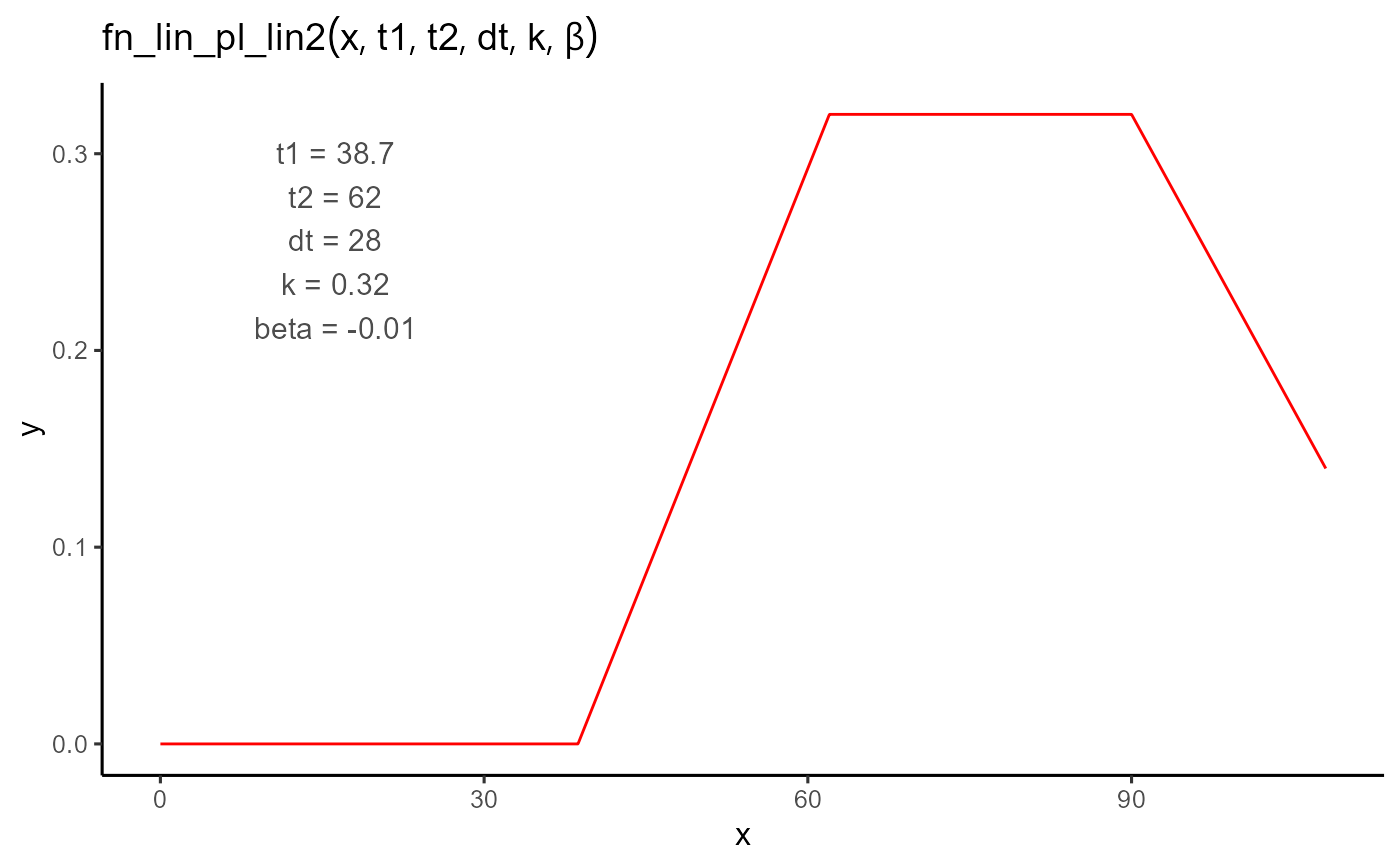
A piecewise function that models an initial linear increase to a plateau, followed by a specified duration of stability, and then a linear decline. This version parameterizes the plateau using its duration rather than an explicit end time, making it convenient for box type of constraints optimizations.
Arguments
- t
A numeric vector of input values (e.g., time).
- t1
The onset time of the response. The function is 0 for all values less than
t1.- t2
The time when the linear growth phase ends and the plateau begins. Must be greater than
t1.- dt
The duration of the plateau phase. The plateau ends at
t2 + dt.- k
The height of the plateau. The linear phase increases to this value, which remains constant for
dtunits of time.- beta
The slope of the decline phase that begins after the plateau. Typically negative.