Computes a value based on a linear growth curve reaching a plateau for time.
Arguments
- t
Numeric. The time value.
- t1
Numeric. The lower threshold time. Default is 45.
- t2
Numeric. The upper threshold time. Default is 80.
- k
Numeric. The maximum value of the function. Default is 0.9. Assumed to be known.
Value
A numeric value based on the threshold model.
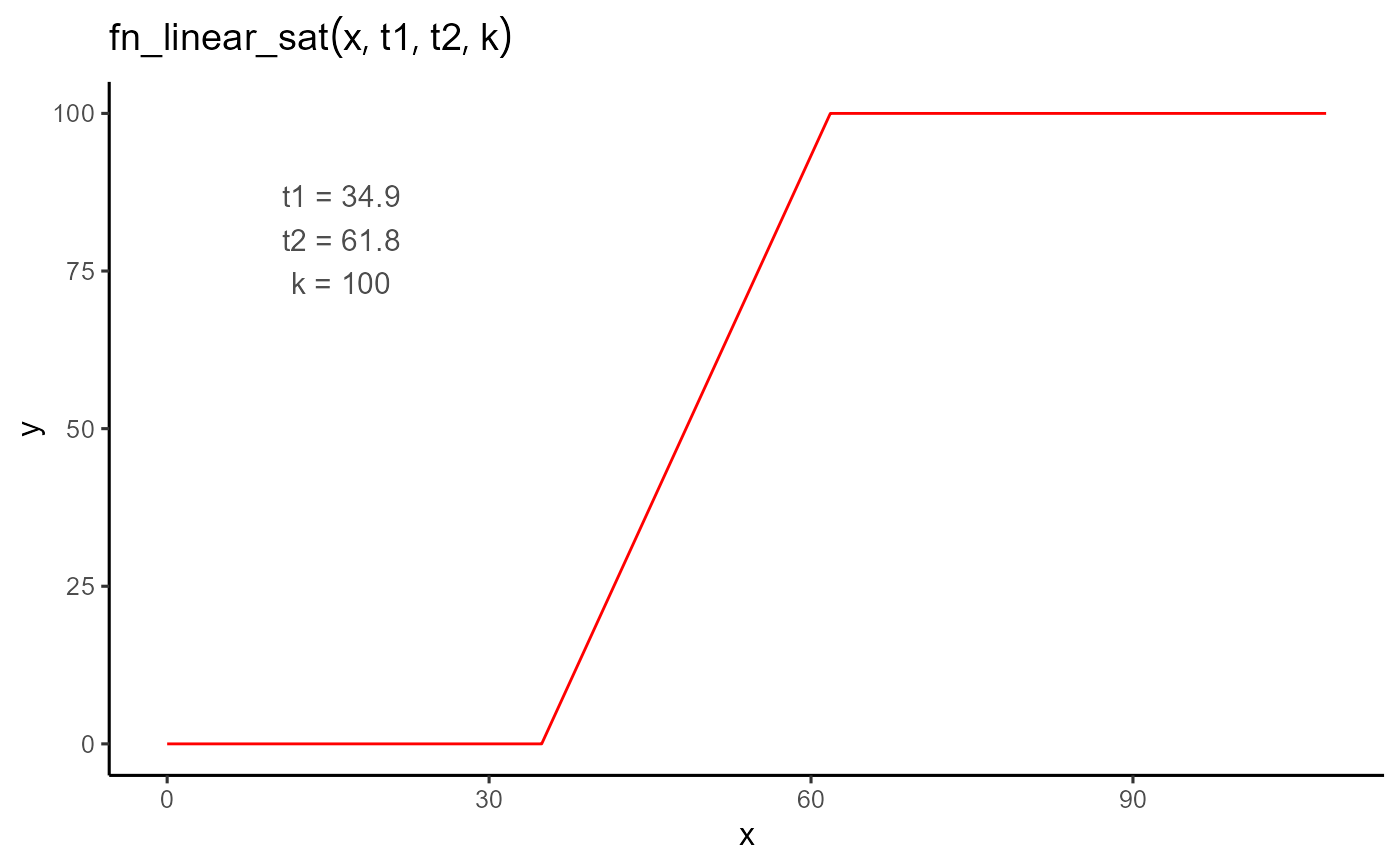
If t is less than t1, the function returns 0.
If t is between t1 and t2 (inclusive),
the function returns a value between 0 and k in a linear trend.
If t is greater than t2, the function returns k.