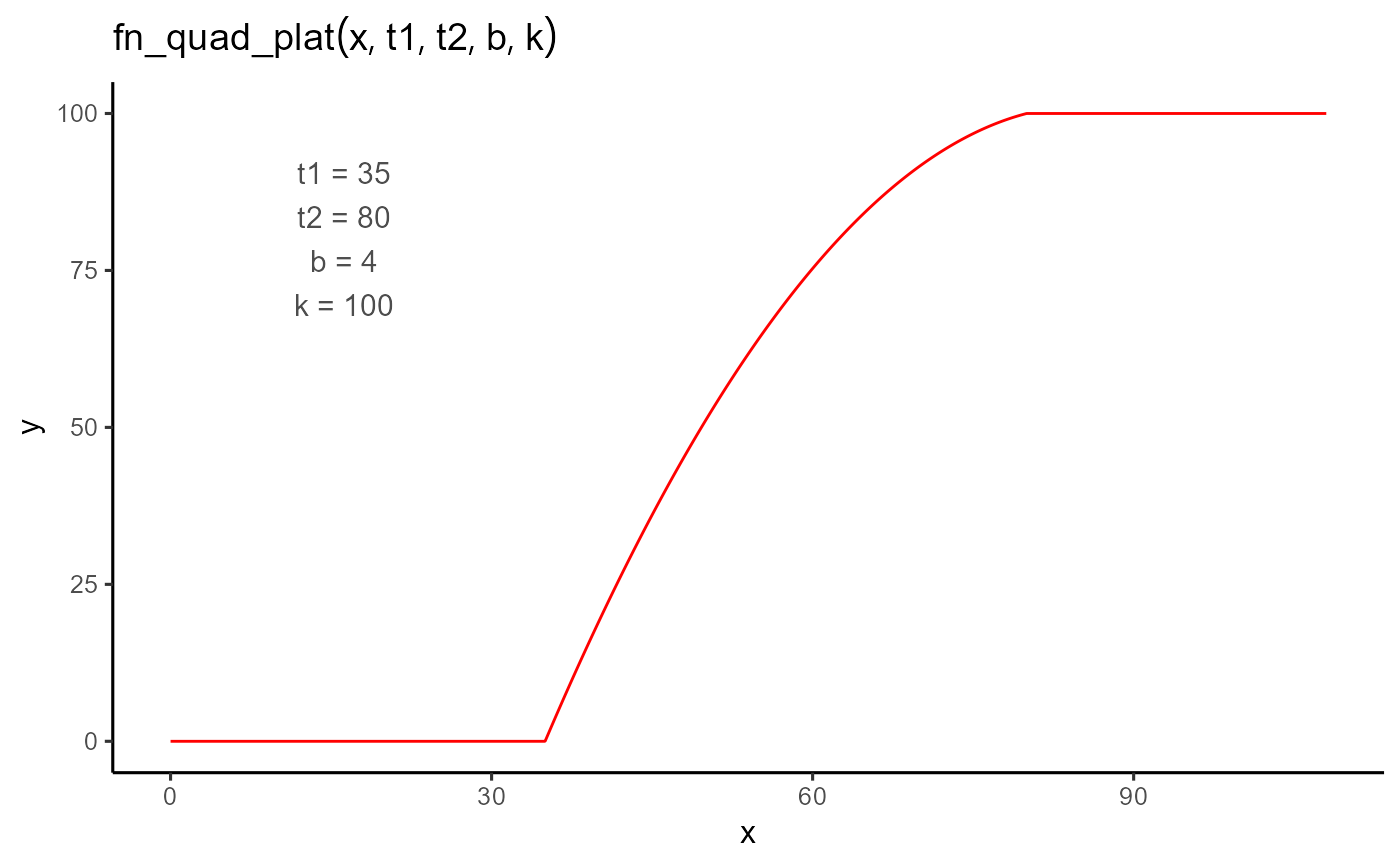
Computes a value based on a quadratic-plateau growth curve.
Arguments
- t
A numeric vector of input values (e.g., time).
- t1
The onset time of the response. The function is 0 for all values less than
t1.- t2
The time at which the plateau begins. Must be greater than
t1.- b
The initial slope of the curve at
t1.- k
The plateau height. The function transitions to this constant value at
t2.
Details
$$ f(t; t_1, t_2, b, k) = \begin{cases} 0 & \text{if } t < t_1 \\ b (t - t_1) + \frac{k - b (t_2 - t_1)}{(t_2 - t_1)^2} (t - t_1)^2 & \text{if } t_1 \leq t \leq t_2 \\ k & \text{if } t > t_2 \end{cases} $$
This function allows the user to specify the initial slope b. The curvature term
is automatically calculated so that the function reaches the plateau value k exactly
at t2. The transition to the plateau is continuous in value but not necessarily smooth
in derivative.