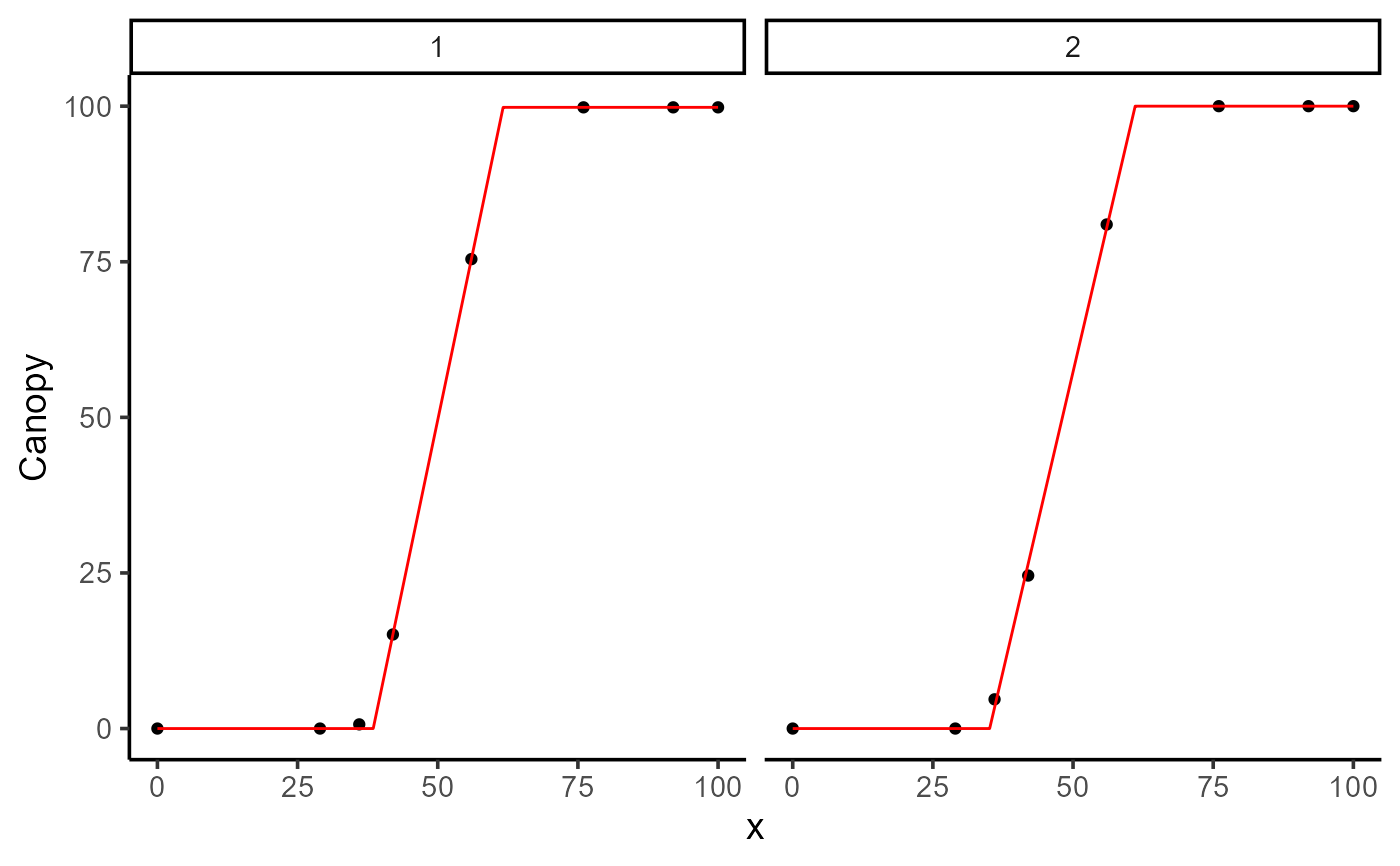
Computes various performance metrics for a modeler object. The function calculates Sum of Squared Errors (SSE), Mean Absolute Error (MAE), Mean Squared Error (MSE), Root Mean Squared Error (RMSE), and the Coefficient of Determination (R-squared).
Details
Sum of Squared Errors (SSE): $$SSE = \sum_{i=1}^{n} (y_i - \hat{y}_i)^2$$Mean Absolute Error (MAE): $$MAE = \frac{1}{n} \sum_{i=1}^{n} |y_i - \hat{y}_i|$$Mean Squared Error (MSE): $$MSE = \frac{1}{n} \sum_{i=1}^{n} (y_i - \hat{y}_i)^2$$Root Mean Squared Error (RMSE): $$RMSE = \sqrt{\frac{1}{n} \sum_{i=1}^{n} (y_i - \hat{y}_i)^2}$$Coefficient of Determination (R-squared): $$R^2 = 1 - \frac{\sum_{i=1}^{n} (y_i - \hat{y}_i)^2}{\sum_{i=1}^{n} (y_i - \bar{y})^2}$$
Examples
library(flexFitR)
data(dt_potato)
mod_1 <- dt_potato |>
  modeler(
    x = DAP,
    y = Canopy,
    grp = Plot,
    fn = "fn_lin_plat",
    parameters = c(t1 = 45, t2 = 80, k = 0.9),
    subset = c(1:2)
  )
plot(mod_1, id = c(1:2))

print(mod_1)
#>
#> Call:
#> Canopy ~ fn_lin_plat(DAP, t1, t2, k)
#>
#> Residuals (`Standardized`):
#>       Min.    1st Qu.     Median       Mean    3rd Qu.       Max.
#> -1.779e+00  0.000e+00  1.000e-08  1.398e-01  1.000e-08  2.236e+00
#>
#> Optimization Results `head()`:
#>  uid   t1   t2     k   sse
#>    1 38.5 61.7  99.8 0.449
#>    2 35.1 61.1 100.0 5.701
#>
#> Metrics:
#>  Groups      Timing Convergence Iterations
#>       2 0.5212 secs        100%   550 (id)
#>
metrics(mod_1)
#> # A tibble: 2 × 9
#>     uid fn_name     var      SSE    MAE    MSE  RMSE    R2     n
#>   <dbl> <chr>       <chr>  <dbl>  <dbl>  <dbl> <dbl> <dbl> <int>
#> 1     1 fn_lin_plat Canopy 0.449 0.0838 0.0561 0.237 1.000     8
#> 2     2 fn_lin_plat Canopy 5.70  0.475  0.713  0.844 1.000     8
