Creates various plots for an object of class explorer.
Depending on the specified type, the function can generate plots that show correlations between variables over x, correlations between x values for each variable, or the evolution of variables over x.
Usage
# S3 method for class 'explorer'
plot(
  x,
  type = "var_by_x",
  label_size = 4,
  signif = FALSE,
  method = "pearson",
  filter_var = NULL,
  id = NULL,
  n_row = NULL,
  n_col = NULL,
  base_size = 13,
  return_gg = FALSE,
  add_avg = FALSE,
  ...
)
Arguments
- x
An object inheriting from class
explorer, resulting from executing the functionexplorer().- type
Character string or number specifying the type of plot to generate. Available options are:
"var_by_x" or 1Plots correlations between variables over x (default).
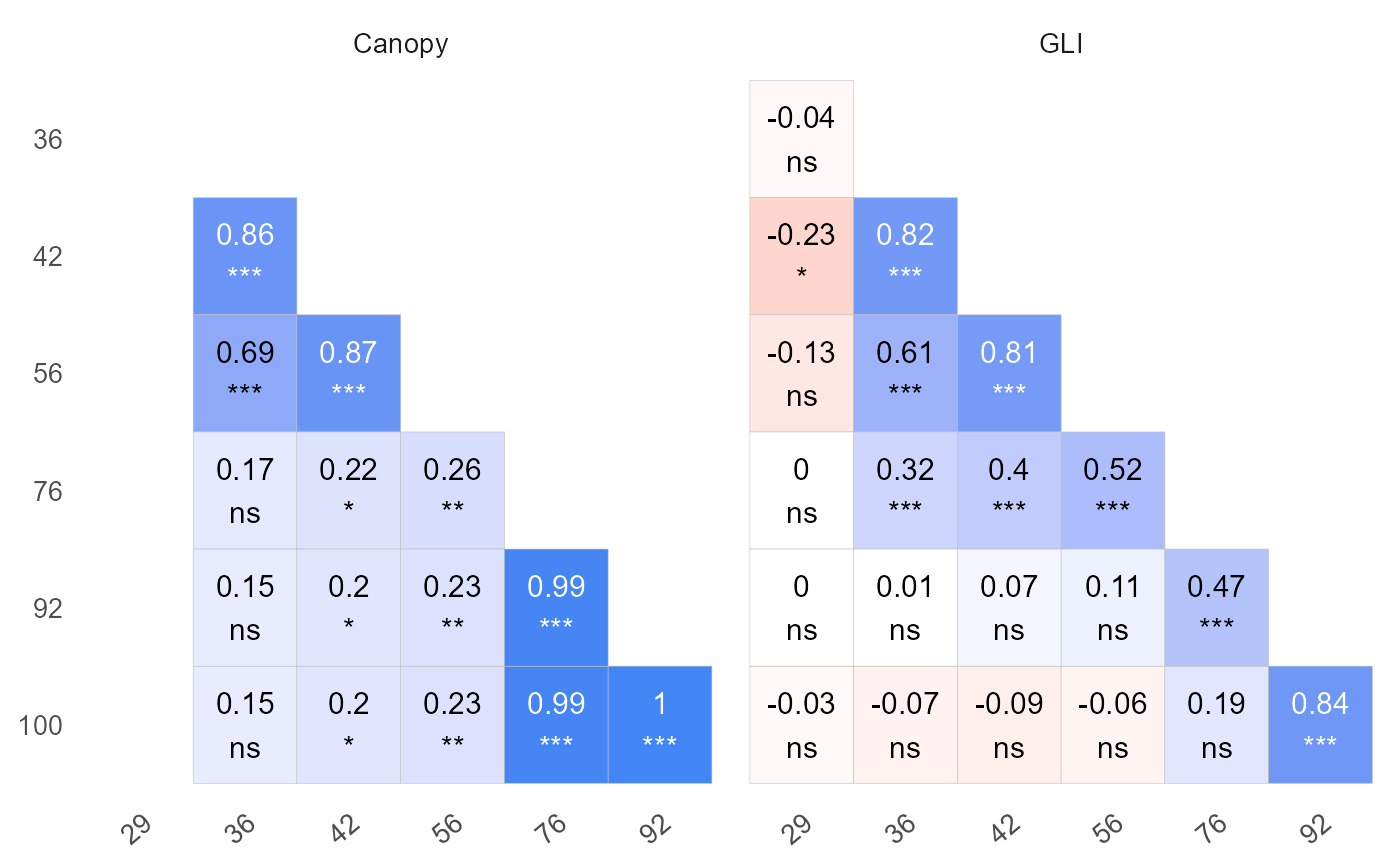
"x_by_var" or 2Plots correlations between x points for each variable (y).
"evolution" or 3Plot the evolution of the variables (y) over x.
"xy" or 4Scatterplot (x, y)
- label_size
Numeric. Size of the labels in the plot. Default is 4. Only works with type 1 and 2.
- signif
Logical. If
TRUE, adds p-values to the correlation plot labels. Default isFALSE. Only works with type 1 and 2.- method
Character string specifying the method for correlation calculation. Available options are
"pearson"(default),"spearman", and"kendall". Only works with type 1 and 2.- filter_var
Character vector specifying the variables to exclude from the plot.
- id
Optional unique identifier to filter the evolution type of plot. Default is
NULL. Only works with type 3.- n_row
Integer specifying the number of rows to use in
facet_wrap(). Default isNULL. Only works with type 1 and 2.- n_col
Integer specifying the number of columns to use in
facet_wrap(). Default isNULL. Only works with type 1 and 2.- base_size
Numeric. Base font size for the plot. Default is 13.
- return_gg
Logical. If
TRUE, returns the ggplot object instead of printing it. Default isFALSE.- add_avg
Logical. If
TRUE, returns evolution plot with the average trend across groups. Default isFALSE.- ...
Further graphical parameters for future improvements.
Value
A ggplot object and an invisible data.frame containing the correlation table when type is "var_by_x" or "x_by_var".
Examples
library(flexFitR)
data(dt_potato)
results <- explorer(dt_potato, x = DAP, y = c(Canopy, GLI), id = Plot)
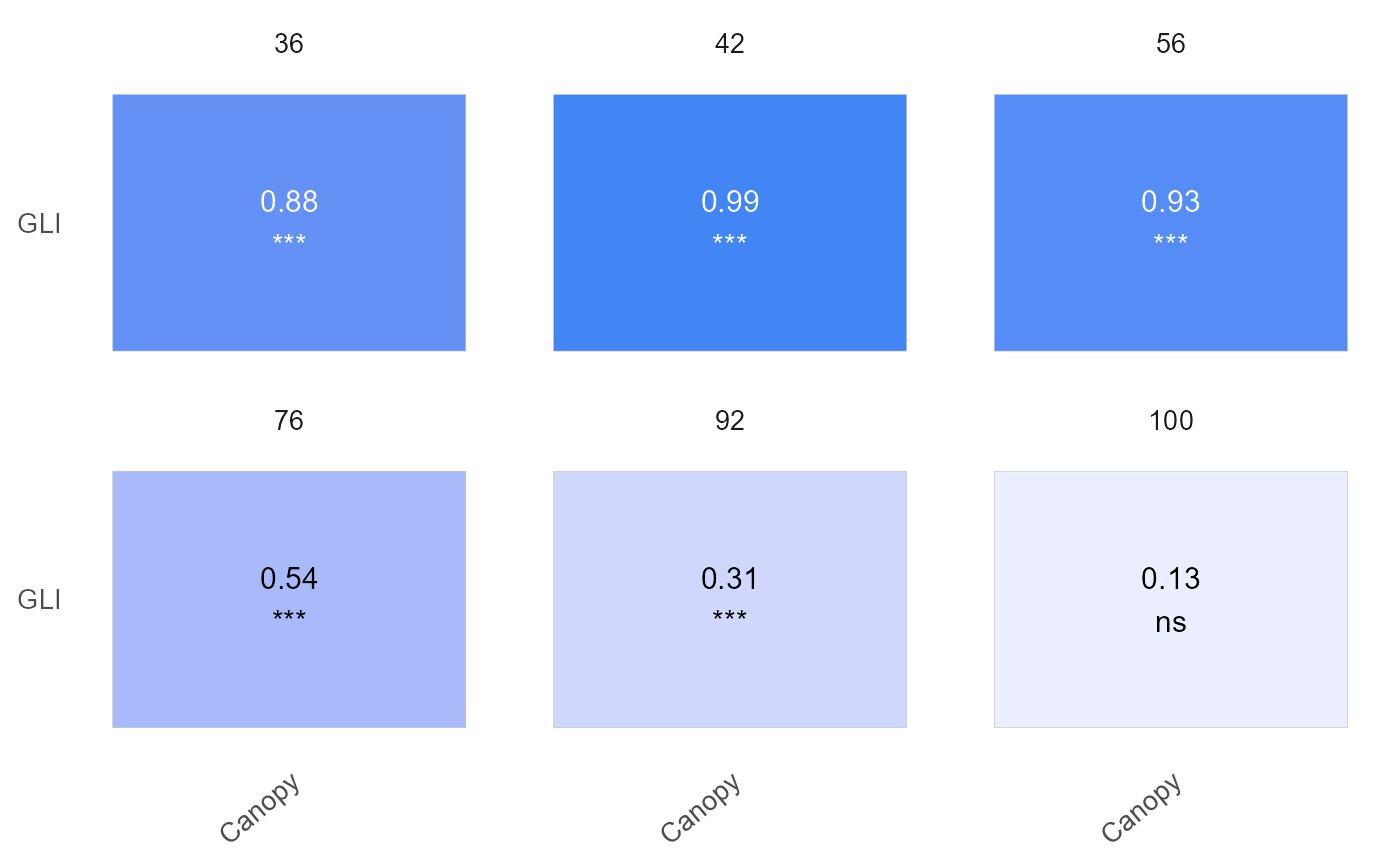
table <- plot(results, label_size = 4, signif = TRUE, n_row = 2)

table
#> # A tibble: 6 × 7
#>       x col    row    corr   p.value     n signi
#>   <dbl> <fct>  <fct> <dbl>     <dbl> <dbl> <fct>
#> 1    36 Canopy GLI    0.88 1.40e- 63   196 ***
#> 2    42 Canopy GLI    0.99 7.92e-179   196 ***
#> 3    56 Canopy GLI    0.93 1.80e- 85   196 ***
#> 4    76 Canopy GLI    0.54 3.66e- 16   196 ***
#> 5    92 Canopy GLI    0.31 1.25e-  5   196 ***
#> 6   100 Canopy GLI    0.13 6.09e-  2   196 ns
plot(results, type = "x_by_var", label_size = 4, signif = TRUE)

