Creates several plots for an object of class modeler.
Usage
# S3 method for class 'modeler'
plot(
  x,
  id = NULL,
  type = 1,
  label_size = 4,
  base_size = 14,
  linewidth = 0.5,
  color = "red",
  color_points = "black",
  parm = NULL,
  n_points = 1000,
  title = NULL,
  add_points = FALSE,
  add_ci = TRUE,
  color_ci = "blue",
  color_pi = "red",
  add_ribbon_ci = FALSE,
  add_ribbon_pi = FALSE,
  color_ribbon_ci = "blue",
  color_ribbon_pi = "red",
  ...
)
Arguments
- x
An object of class
modeler, typically the result of callingmodeler().- id
An optional group ID to filter the data for plotting, useful for avoiding overcrowded plots.
- type
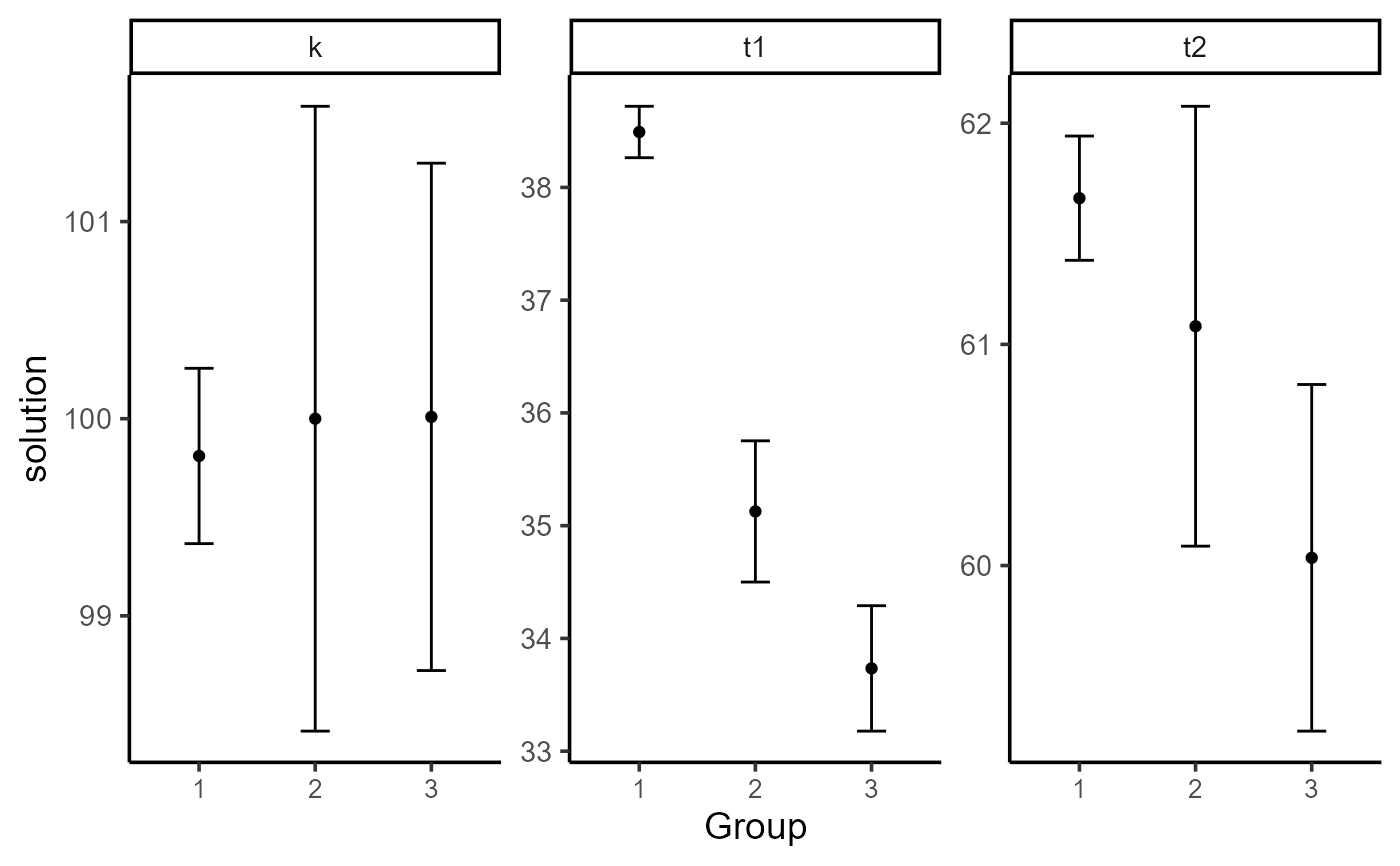
Numeric value (1-6) to specify the type of plot to generate. Default is 1.
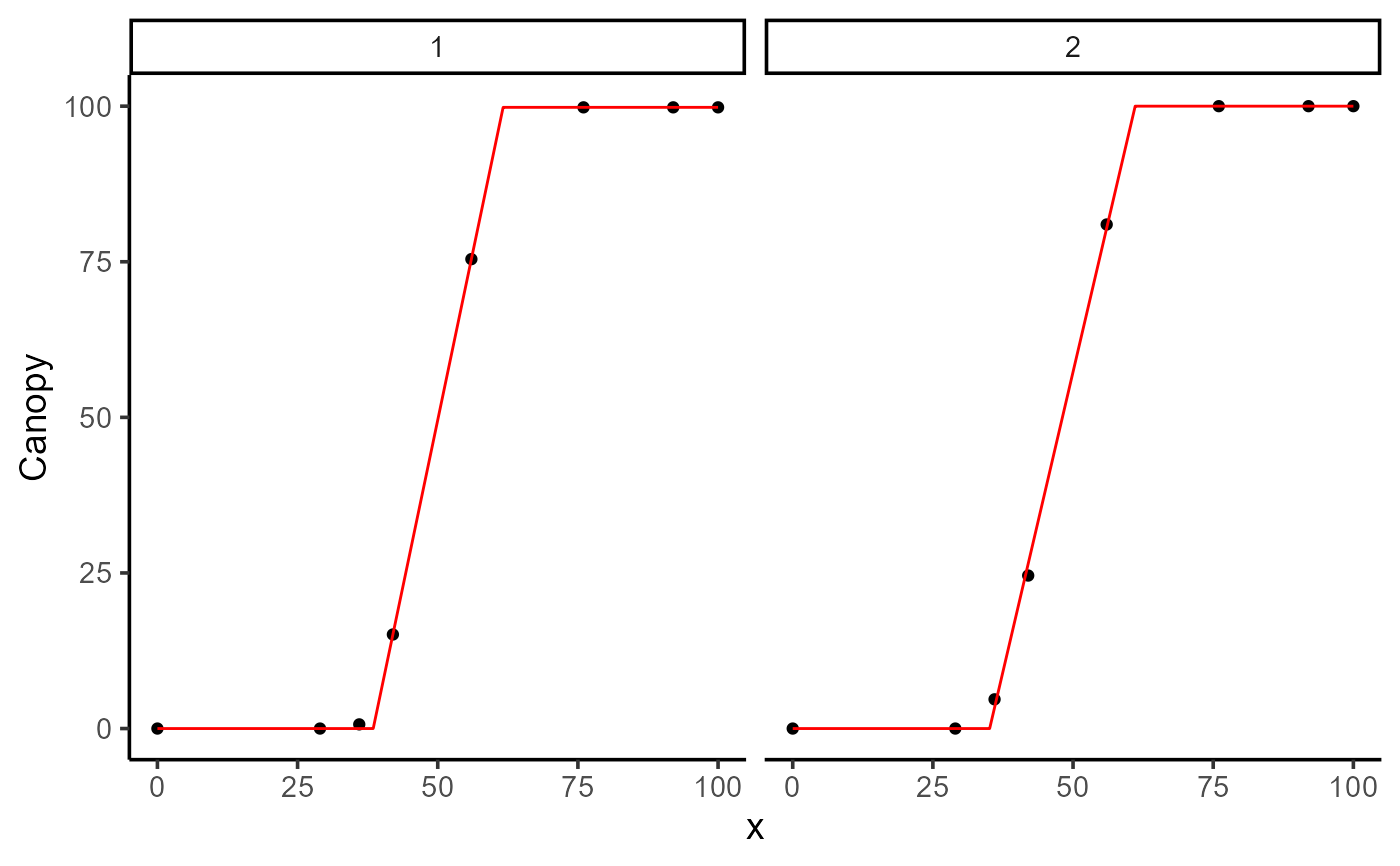
type = 1Plot of raw data with fitted curves.
type = 2Plot of coefficients with confidence intervals.
type = 3Plot of fitted curves, colored by group.
type = 4Plot of fitted curves with confidence intervals.
type = 5Plot of first derivative with confidence intervals.
type = 6Plot of second derivative with confidence intervals.
- label_size
Numeric value for the size of labels. Default is 4.
- base_size
Numeric value for the base font size in pts. Default is 14.
- linewidth
Numeric value specifying size of line geoms. Default is 0.5.
- color
Character string specifying the color for the fitted line when
type = 1. Default is "red".- color_points
Character string specifying the color for the raw data points when
type = 1. Default is "black".- parm
Character vector specifying the parameters to plot for
type = 2. IfNULL, all parameters are included.- n_points
Numeric value specifying the number of points for interpolation along the x-axis. Default is 2000.
- title
Optional character string to add a title to the plot.
- add_points
Logical value indicating whether to add raw observations to the plot for
type = 3 and 4. Default isFALSE.- add_ci
Logical value indicating whether to add confidence intervals for
type = 4, 5, 6. Default isTRUE.- color_ci
Character string specifying the color of the confidence interval when
type = 4, 5, 6. Default is "blue".- color_pi
Character string specifying the color of the prediction interval when
type = 4. Default is "red".- add_ribbon_ci
Logical value indicating whether to add a ribbon for confidence intervals in
type = 4, 5, 6. Default isFALSE.- add_ribbon_pi
Logical value indicating whether to add a ribbon for prediction intervals in
type = 4. Default isFALSE.- color_ribbon_ci
Character string specifying the color of the ribbon (ci). Default is "blue".
- color_ribbon_pi
Character string specifying the color of the ribbon (pi). Default is "red".
- ...
Additional graphical parameters for future extensions.
Examples
library(flexFitR)
data(dt_potato)
# Example 1
mod_1 <- dt_potato |>
  modeler(
    x = DAP,
    y = Canopy,
    grp = Plot,
    fn = "fn_lin_plat",
    parameters = c(t1 = 45, t2 = 80, k = 0.9),
    subset = c(1:3)
  )
print(mod_1)
#>
#> Call:
#> Canopy ~ fn_lin_plat(DAP, t1, t2, k)
#>
#> Residuals (`Standardized`):
#>       Min.    1st Qu.     Median       Mean    3rd Qu.       Max.
#> -1.779e+00  0.000e+00  1.000e-08  9.317e-02  5.382e-03  2.236e+00
#>
#> Optimization Results `head()`:
#>  uid   t1   t2     k   sse
#>    1 38.5 61.7  99.8 0.449
#>    2 35.1 61.1 100.0 5.701
#>    3 33.7 60.0 100.0 3.759
#>
#> Metrics:
#>  Groups      Timing Convergence Iterations
#>       3 0.4369 secs        100%   566 (id)
#>
plot(mod_1, id = 1:2)

plot(mod_1, id = 1:3, type = 2, label_size = 10)