Creates plots for an object of class performance
Usage
# S3 method for class 'performance'
plot(
  x,
  id = NULL,
  type = 1,
  rescale = FALSE,
  linewidth = 1,
  base_size = 12,
  return_table = FALSE,
  ...
)
Arguments
- x
An object of class
performance, typically the result of callingperformance().- id
An optional group ID to filter the data for plotting, useful for avoiding overcrowded plots. This argument is not used when type = 2.
- type
Numeric value (1-3) to specify the type of plot to generate. Default is 1.
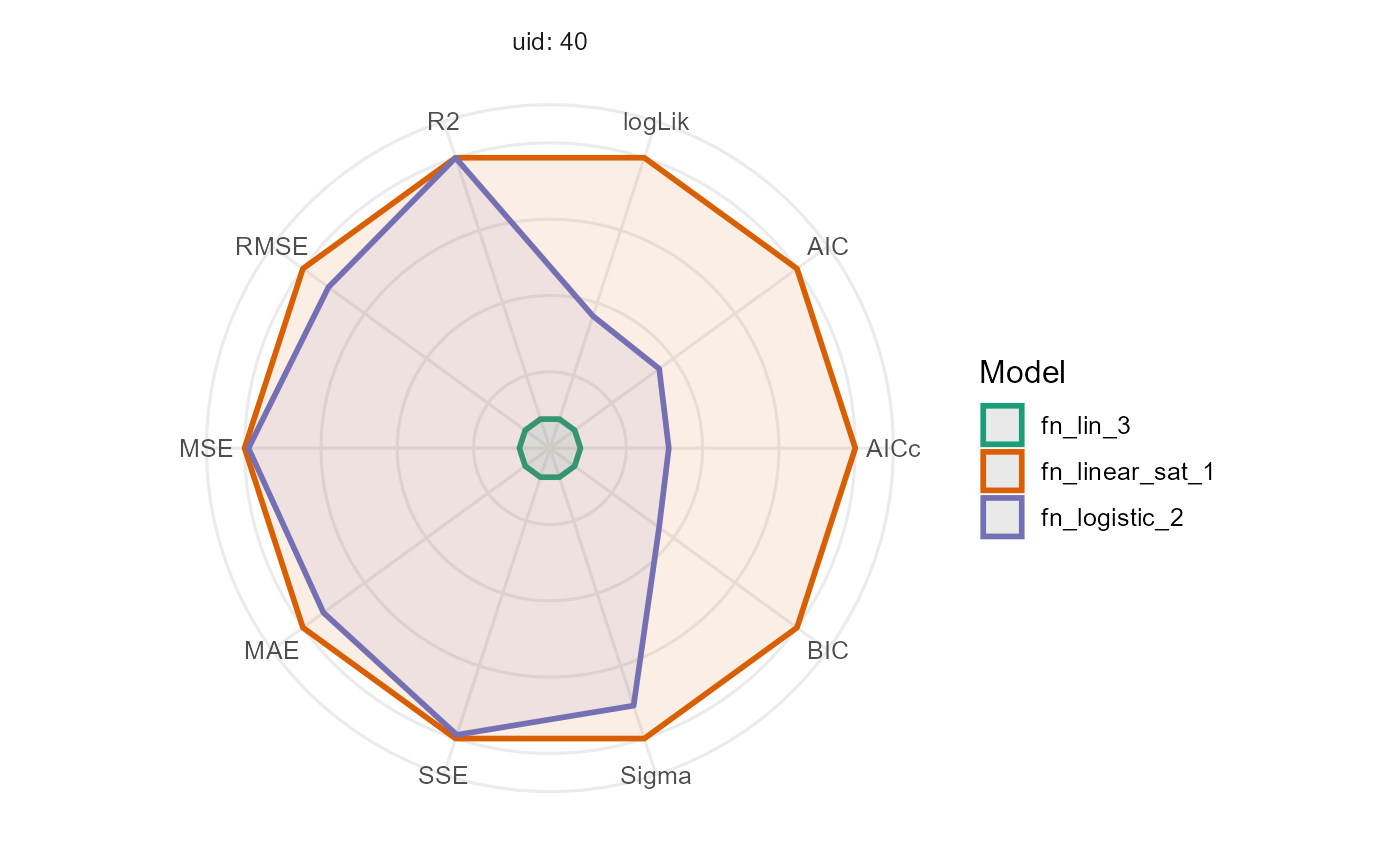
type = 1Radar plot by uid
type = 2Radar plot averaging
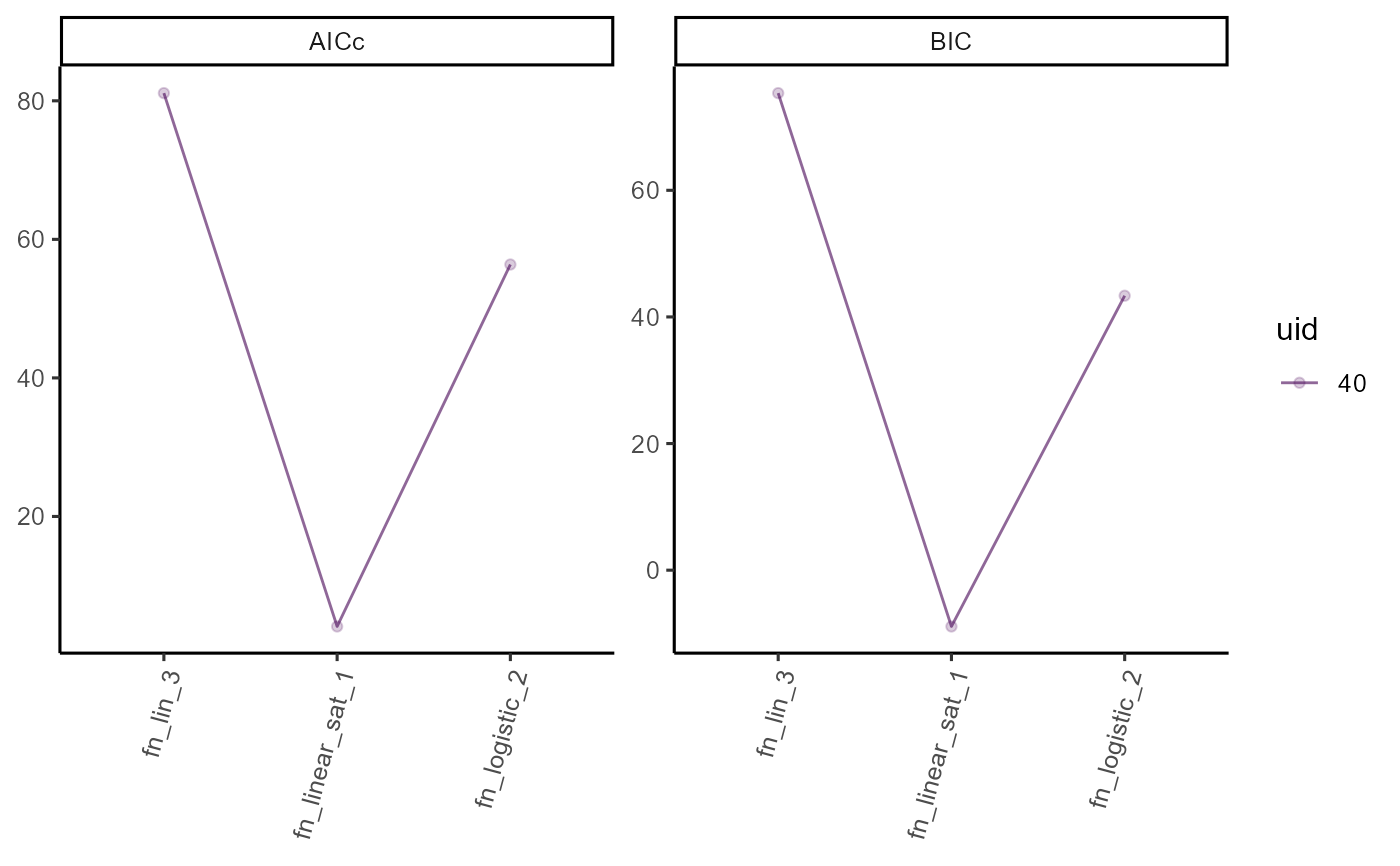
type = 3Line plot by model-metric
type = 4Ranking plot by model
- rescale
Logical. If
TRUE, metrics in type 3 plot are (0, 1) rescaled to improve interpretation. Higher values are better models.FALSEby default.- linewidth
Numeric value specifying size of line geoms.
- base_size
Numeric value for the base font size in pts. Default is 12
- return_table
Logical. If
TRUE, table to generate the plot is returned.FALSEby default.- ...
Additional graphical parameters for future extensions.
Examples
library(flexFitR)
data(dt_potato)
# Model 1
mod_1 <- dt_potato |>
  modeler(
    x = DAP,
    y = Canopy,
    grp = Plot,
    fn = "fn_lin_plat",
    parameters = c(t1 = 45, t2 = 80, k = 90),
    subset = 40
  )
# Model 2
mod_2 <- dt_potato |>
  modeler(
    x = DAP,
    y = Canopy,
    grp = Plot,
    fn = "fn_logistic",
    parameters = c(a = 0.199, t0 = 47.7, k = 100),
    subset = 40
  )
# Model 3
mod_3 <- dt_potato |>
  modeler(
    x = DAP,
    y = Canopy,
    grp = Plot,
    fn = "fn_lin",
    parameters = c(m = 20, b = 2),
    subset = 40
  )
plot(performance(mod_1, mod_2, mod_3), type = 1)

plot(performance(mod_1, mod_2, mod_3, metrics = c("AICc", "BIC")), type = 3)