Prints information about modeler function.
Usage
# S3 method for class 'modeler'
print(x, ...)
Arguments
- x
An object fitted with the function
modeler().- ...
Options used by the tibble package to format the output. See `tibble::print()` for more details.
Examples
library(flexFitR)
data(dt_potato)
mod_1 <- dt_potato |>
  modeler(
    x = DAP,
    y = Canopy,
    grp = Plot,
    fn = "fn_lin_plat",
    parameters = c(t1 = 45, t2 = 80, k = 0.9),
    subset = c(1:5)
  )
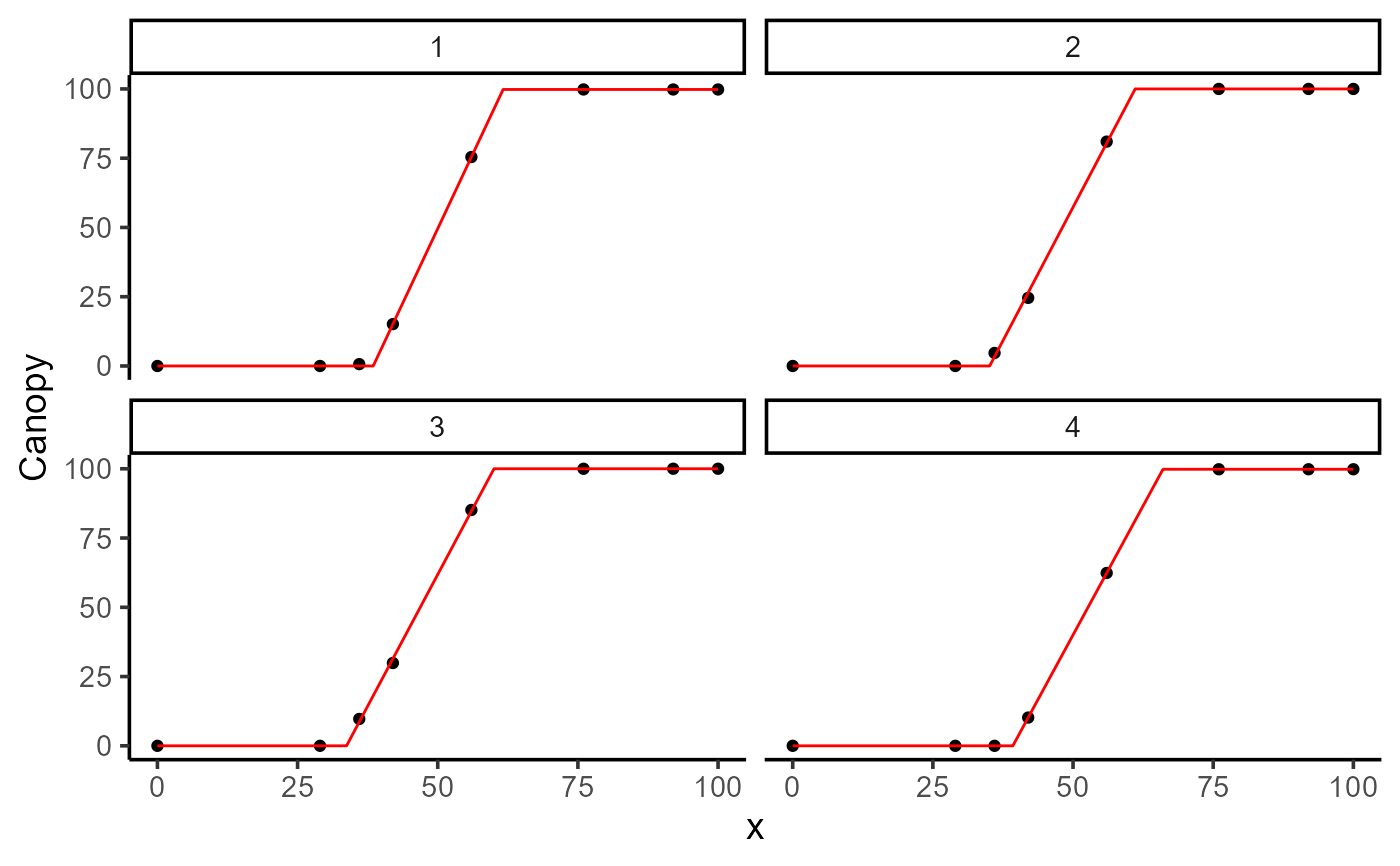
plot(mod_1, id = c(1:4))

print(mod_1)
#>
#> Call:
#> Canopy ~ fn_lin_plat(DAP, t1, t2, k)
#>
#> Residuals (`Standardized`):
#>       Min.    1st Qu.     Median       Mean    3rd Qu.       Max.
#> -1.779e+00  0.000e+00  1.000e-08  2.329e-01  5.337e-01  2.236e+00
#>
#> Optimization Results `head()`:
#>  uid   t1   t2     k      sse
#>    1 38.5 61.7  99.8 4.49e-01
#>    2 35.1 61.1 100.0 5.70e+00
#>    3 33.7 60.0 100.0 3.76e+00
#>    4 39.3 66.0  99.8 1.46e-18
#>
#> Metrics:
#>  Groups      Timing Convergence Iterations
#>       5 0.8558 secs        100% 481.6 (id)
#>
